Avoid迴避
Research view (initial coverage, not advice)研究觀點(初次評估,非投資建議) ◆
Default path: Summary → Numbers → Catalysts → Playbook (~8 min). The full argument is collapsed — open only what you need.預設動線:摘要 → 數字 → 催化劑 → 操作框架(約 8 分鐘);完整論證已收合,點開展開。
The power shortage is real, and CAT genuinely captures its share of that demand. The problem is the price — today's stock is valued as though the whole company were nothing but the 45%-of-revenue Power & Energy segment. 電力缺口是真的,CAT 也確實吃得到這塊需求。問題出在價格:現在的股價,等於把整家公司都當成那個只佔營收 45% 的 Power & Energy 部門在定價。
Why this page skips PBR (price-to-book): CAT has been buying back its own stock for years, and that has shrunk the book equity on its balance sheet down to a number that no longer means much. For this company, that ratio just doesn't tell you anything useful — US industrial stocks are usually judged on PER (price-to-earnings) or EV-EBITDA instead.為什麼不列 PBR(股價淨值比):CAT 連年買回自家股票,帳面淨值已經被壓縮到失真,這個指標對它沒有參考價值——美系工業股一般改看本益比(PER)或 EV-EBITDA。
(1) The $72B order backlog is a waiting list, not a growth engine. Backlog means orders customers have already placed that CAT hasn't shipped yet — it's now built up to $72B, up 92% from a year ago, which sounds like an explosion in demand. But look inside the filings: the revenue CAT actually books from delivered power equipment has slowed for three quarters straight — +44% (Q4'25) → +41% (Q1'26) → +29% (Q2'26) — while in that same quarter, management said the volume actually reaching end users (what the company calls "sales-to-users") grew +72%. Put those two numbers side by side and the story flips: demand isn't the thing accelerating, CAT just can't ship fast enough, so orders keep stacking up in line. And lines get worked down — the whole industry's new capacity lands together in 2027-29, and the day that queue gets shorter, the "backlog up 92%" story runs out of fuel on its own. The market is currently pricing that queue as though it were a growth signal, not a supply bottleneck with a scheduled end date.
(1) $72B 的在手訂單,是「排隊名單」,不是「成長引擎」。在手訂單(backlog)=客戶已下單、CAT 還沒交貨的金額,現在累積到 $72B、年增 92%——聽起來像需求爆發。但翻開財報:發電設備真正交貨認列的營收,增速已連三季下滑(+44% → +41% → +29%);同一季管理層卻說,實際交到用戶手上的量(sales-to-users)年增 72%。兩個數字擺在一起的意思是:不是需求還在變快,是 CAT 出貨出不夠快,訂單只好排隊。而隊伍會消化:全行業的新產能 2027–29 年同時開出,隊伍變短的那天,「訂單年增 92%」這個故事就自動結束。市場現在把「排隊」當成「成長」在定價。
(2) The stock is priced as if a 15% business were 100% of the company. Today's price runs 36.8 times CAT's trailing-year profit (a P/E of 36.8x — put plainly, you're paying up front for 36.8 years of the profit CAT earns today), while CAT's own 10-year normal range is only 12-19 times. What business deserves double that price tag? The power-generation gear CAT sells into AI data centers. But that business runs at roughly $12B a year — just 15% of total company revenue; even counting the entire Power & Energy segment, it's still only 45%. The rest, more than half the company, is old-fashioned excavators, dozers and mining equipment — and that half is currently sitting at a shipment peak: construction-machinery revenue grew 35% last quarter, partly because dealers restocked their shelves (bought ahead of what they'd actually sold), and the company itself has already told investors dealer inventory needs to come down by more than $1B in Q4.
(2) 股價把 15% 的生意,當成 100% 在定價。現在的股價,是 CAT 過去一年獲利的 36.8 倍(本益比 36.8x);而 CAT 自己過去十年的常態,只有 12–19 倍。什麼生意值得翻倍的身價?AI 資料中心的發電生意。但那塊生意(Power Generation 發電應用)年化約 $12B,只佔全公司營收 15%;就算把整個能源部門算進去,也只有 45%。剩下超過一半,是傳統的挖土機、推土機、礦業設備——而且這一半正站在出貨高點:上一季營建機械年增 35%,有一部分是經銷商補庫存墊出來的(先進貨、還沒賣掉),公司自己已預告第四季經銷商要把庫存降 $1B 以上。
(3) The supply wall is harder to dodge than the demand wall. Bears worry about demand — states are starting to block new data centers. This analysis worries more about supply: CAT's own big-engine capacity is expanding to nearly 3x its 2024 level, landing in 2027-29 — the exact same window when GE Vernova(GEV), Siemens Energy, Mitsubishi Heavy Industries(MHI), Cummins(CMI), Wärtsilä and Rolls-Royce(RR) mtu are all expanding capacity too. Turbine prices are already +195% since 2019 (Wood Mackenzie). When everyone's new plants come online at the same time, a shortage premium usually ends only one way. Demand breaking down needs bad news to happen. Supply catching up needs nothing at all — it just arrives on schedule.
(3) 供給牆,比需求牆更難躲。看空的人擔心需求(州政府開始擋資料中心);本研究更擔心供給:CAT 的大引擎產能要擴到 2024 年的近 3 倍,落地時間 2027–29——而 GE Vernova、Siemens Energy、三菱重工、Cummins、Wärtsilä 全部都在同一個窗口擴產。發電渦輪機的價格,已經比 2019 年貴了 195%(Wood Mackenzie)。當所有人的新廠同時開出來,「供不應求溢價」的歷史結局通常只有一種。需求要出事,需要壞消息;供給到位,不需要任何壞消息——時間到了它就來。
TP:目標價: This analysis estimates CAT's adjusted EPS (adj EPS — earnings per share after stripping out one-off items, i.e. what each share actually earned) at $26.50 for 2026 and $30.00 for 2027. The 6-month target price is $780, built from one formula: 2027E EPS $30.00 × a 26x P/E multiple (P/E, or PER — price divided by a year's earnings per share; put plainly, how many years of today's profit you're paying to own the stock).
CAT's own trailing P/E has run only about 18.5x over the last ten years (a 12-19x band from 2018-2024). This analysis grants it 26x because Power & Energy is now the company's largest segment and still structurally growing (45% of revenue, a deepening services annuity) — that earns a premium above the historical range. But the 2027-29 industrywide capacity wave, plus Construction and Resource Industries sitting at a late-cycle peak, can't support today's 29-33x "the whole company is an AI stock" pricing.
(a calibration detail — skip freely) One catch: that 18.5x median is a trailing multiple, based on past earnings, while this analysis's 26x is applied forward, to next year's estimated earnings (FY27E). Converting to the same basis — using today's trailing/forward ratio of 36.8/29.2 ≈ 1.26 — 26x forward works out to roughly 33x trailing, still about 1.8 times the 10-year median. So: this analysis has already handed the structural story nearly double its historical multiple, and the math still doesn't reach today's price. 本研究預估 CAT 2026、2027 年的調整後每股盈餘(adj EPS,剔除一次性項目後每一股實際賺到的錢)分別為 $26.50、$30.00。目標價 $780(6 個月視角),算法是:2027 年預估 EPS $30.00 × 26 倍本益比(PER,股價除以每股一年獲利——等於用幾年的獲利買下這家公司)。
CAT 過去十年的 trailing 本益比中位數只有約 18.5 倍(2018-24 年的常態帶是 12-19 倍)。本研究給它 26 倍,是因為 Power & Energy 已經是最大、而且還在結構性成長的部門(占營收 45%、服務型收入越來越厚),值得比歷史區間高一截。但 2027-29 年全行業新產能同時開出,加上 CI/RI 正站在晚週期高點,撐不起現在 29-33 倍「把全公司當 AI 股」的定價。
(估算依據,供查核,可跳過)口徑警示:18.5 倍中位數是用「過去」的獲利算的(trailing),本研究的 26 倍卻是套在「明年」的獲利上(forward,即 FY27E)——換算成同一種口徑(現況 trailing/forward 比 36.8/29.2 ≈ 1.26),26 倍 forward 大約等於 33 倍 trailing,仍是十年中位數的 ~1.8 倍。也就是說,本研究已經給了這個結構故事將近兩倍的歷史倍數,算出來還是到不了現在的股價。
Risk factors: the stock trades well above its own history (36.8x today vs. an 18.45x ten-year median) · state governments are starting to block new data centers (a moratorium) · 2027-28 brings a wave of new capacity across the whole industry that could undercut today's premium pricing (the capacity wall) · the traditional machinery businesses (Construction and Resource Industries) are heading into the kind of dealer-inventory correction that shows up late in a business cycle.
風險因子:現在的股價比自己的歷史貴很多(36.8 倍 vs 過去十年中位數 18.45 倍)· 州政府開始擋資料中心(暫停令,moratorium)· 2027-28 全行業新產能一起開出,可能壓垮現在的高定價(產能牆)· CI/RI 這兩塊傳統機械業務正要進入經銷商去庫存修正,是景氣循環晚期常見的訊號(晚週期去庫)。
Sources for this section (consolidated here instead of inline): price & valuation = IBKR (08-04) + computed · 2Q26/1Q26 actuals = CAT earnings releases + call transcripts · industry data = Wood Mackenzie (04-01) / Global Energy Monitor / IEA · sell-side consensus = stockanalysis (07-29, pre-Q2) / Zacks via MarketBeat (07-16) · estimates, TP and view = this analysis ◆. Per-number ledger: see the Sources section.本節出處(統一註記於此,不逐句插標):價格與估值=IBKR(08-04)+本研究計算 · 2Q26/1Q26 實績=CAT earnings releases+法說會逐字稿 · 產業數據=Wood Mackenzie(04-01)/Global Energy Monitor/IEA · 賣方共識=stockanalysis(07-29,財報前)/Zacks via MarketBeat(07-16)· 預估、目標價與觀點=本研究判斷 ◆。逐數字查證表見〈資料出處〉。
| $B except per-share,每股例外 | FY2024A | FY2025A | FY2026E ◆ | FY2027E ◆ |
|---|---|---|---|---|
| Revenue營業收入 | 64.809 ✓ | 67.589 ✓ | 78.7 ◆ | 85.0 ◆ |
| Revenue YoY營收 YoY | -3.4% ✓ | +4.3% ✓ | +16.4% ◆ | +8.0% ◆ |
| Adj. op. marginAdj 營益率 | 20.7% ✓ | 17.2% ✓ | 19.8% ◆ | 20.3% ◆ |
| Adj. EPSAdj EPS | $21.90 ✓ | $19.06 ✓ | $26.50 ◆ | $30.00 ◆ |
| PER | — | 46.0x* ◆ | 33.1x ◆ | 29.2x ◆ |
(methodology fine print — skip freely) *The FY25 PER figure divides today's price by that year's EPS, shown for reference only — a proper historical-year PER should use that year's average price, which this analysis didn't reconstruct. FY24/FY25 columns are actuals from the FY2025 10-K. FY26E/FY27E are this analysis's own estimates. Basis: FY26E revenue uses the company's own guidance of "mid-to-high teens" growth (H1 actually ran +23.2%, which implies H2 slows to +10.7% — that's the guided Q4 dealer-inventory pullback showing up in the math); FY26E EPS = H1 actual $13.71 + H2 estimate $12.79 (built off H2'25's $10.09 × 1.27, reflecting tariffs rolling off plus Power Generation ramping, and excluding a repeat of Q2's one-time IEEPA tariff recovery); FY27E assumes revenue +8% (new P&E capacity shipments offsetting weaker Construction Industries), margin +50bps from mix shift, and roughly 460M shares outstanding (buybacks continuing).(估算依據,供查核,可跳過)*FY25 本益比是用現在的股價除以那一年的 EPS,僅供對照——嚴謹算法應該用「那一年的平均股價」,本研究這裡沒有重建。FY24/FY25 欄位是 FY2025 10-K 的實際數字;FY26E/FY27E 是本研究自己的估計。算法:FY26E 營收用公司自己的指引「mid-to-high teens」(H1 實際成長 +23.2%,隱含 H2 要放緩到 +10.7%——這正是公司預告的 Q4 經銷商去庫,反映在數字上);FY26E EPS=H1 實績 $13.71 + H2E $12.79(用 H2'25 的 $10.09 × 1.27 推算,反映關稅逐步淡出+Power Generation 放量,並排除 Q2 那筆一次性 IEEPA 關稅回收的重複計入);FY27E 假設營收 +8%(P&E 新產能出貨抵銷 CI 走弱)、營益率因產品組合改善 +50bps、股數約 460M(買回持續)。
This analysis vs. the market consensus: "consensus" here just means the average forecast across all the sell-side analysts covering the stock — sell-side meaning the research arms of brokerage firms. This analysis's FY26E EPS is $26.50, versus a consensus of $24.72 (stockanalysis.com, 2026-07-29, ⚠ pre-Q2-beat, stale) — that's +7.2% above consensus. For FY27E, this analysis's EPS is $30.00, versus a consensus of $31.08 (Zacks via MarketBeat, 2026-07-16, ⚠ pre-Q2-beat, stale) — that's -3.5% below consensus.
Why the split matters: both consensus numbers were written before CAT's Q2 earnings beat (a "beat" just means the company reported results well above what analysts had forecast), so they're mechanically due for an upward revision once analysts catch up. Running above that stale FY26 number doesn't say much — it just means "the beat already happened, the consensus hasn't caught up yet." What actually signals a genuine difference of opinion is FY27: sitting below consensus there, even after the beat, is this analysis's real disagreement with the market.
本研究 vs 市場共識:「共識(consensus)」指的是所有追蹤這檔股票的賣方(sell-side,券商研究部門)分析師預估的平均值。本研究的 FY26E EPS 是 $26.50,對比共識 $24.72(stockanalysis.com,2026-07-29,⚠ pre-Q2 beat,已過時)——高出共識 +7.2%;FY27E EPS 是 $30.00,對比共識 $31.08(Zacks via MarketBeat,2026-07-16,⚠ pre-Q2 beat,已過時)——低於共識 -3.5%。
這個落差為什麼重要:兩份共識數字都是在 CAT 公布 Q2 大幅超預期之前寫的,照理說接下來一定會被機械性地往上調整。本研究 FY26 高於這個已經過時的共識,其實沒有太多意義——只是「beat 已經發生,共識還沒跟上」而已。真正代表立場不同的是 FY27:即使財報超預期之後,本研究仍然低於共識,這才是本研究與市場真正的分歧點。
Here's the rule before the numbers: a target price is just "estimated earnings × a fair multiple." Everything else people argue about boils down to two questions — how much profit to assume, and what multiple to pay for it.
先講規則:目標價的算法是「預估獲利 × 合理本益比」。剩下的爭論只有兩個字:獲利抓多少、倍數給多少。
This analysis puts CAT's adjusted EPS at $26.50 for 2026 and $30.00 for 2027; the 6-month target price is $780, from 2027E EPS $30.00 × a 26x P/E. CAT's own 10-year trailing P/E median runs about 18.5x (2018-24 band ~12-19x, GuruFocus ⚠). This analysis grants 26x because Power & Energy is now the company's largest, still-structurally-growing segment (45% of revenue, a deepening services annuity) — that earns a premium above the historical range. But the 2027-29 industrywide capacity wave, plus CI/RI sitting at a late-cycle peak, doesn't support today's 29-33x "whole-company-is-AI" pricing.
本研究預估 CAT 2026、2027 年 adj EPS 為 $26.50、$30.00,目標價 $780(6 個月視角),算法是2027E EPS $30.00 × 26 倍本益比。CAT 自己過去十年的 trailing 本益比中位數約 18.5 倍(2018-24 常態帶 ~12-19 倍,GuruFocus ⚠)。本研究給它 26 倍,是因為 P&E 已經是公司最大、且仍在結構性成長的部門(占營收 45%、服務型收入越來越厚),值得比歷史區間高一截;但 2027-29 全行業新產能齊發,加上 CI/RI 正站在晚週期高點,撐不起現在 29-33 倍「把全公司當 AI 股」的定價。
◆ (a calibration detail — skip freely) The 18.5x median is a trailing multiple; the TP's 26x is applied forward, to FY27E earnings. Converting to the same basis — using today's trailing/forward ratio of 36.8/29.2 ≈ 1.26 — 26x forward works out to roughly 33x trailing, still about 1.8 times the 10-year median. This analysis has already handed the structural story nearly double its historical multiple, and the math still doesn't reach today's price.
◆(口徑細節,供查核,可跳過)18.5 倍中位數是用「過去」的獲利算的(trailing),目標價用的 26 倍卻套在「明年」的獲利上(forward,即 FY27E)——換算成同一種口徑(用現況 trailing/forward 比 36.8/29.2 ≈ 1.26 換算),26 倍 forward 大約等於 33 倍 trailing,仍是十年中位數的 ~1.8 倍。也就是說,本研究已經給了這個結構故事將近兩倍的歷史倍數,算出來還是到不了現在的股價。
| Scenario情境 | Prob.機率 ◆ | Key assumptions關鍵假設 | FY27E EPS × multipleEPS×倍數 | Implied price隱含價 |
|---|---|---|---|---|
| BearBear | 25% | AI-capex digestion year + a third state moratorium + CI hard landing; PG growth <15%AI capex 消化年+第三州 moratorium+CI 硬著陸;PG 增速 <15% | $26 × 20x | $520 |
| BaseBase | 50% | Demand holds, capacity ships on time, growth decelerates mechanically; mild CI destock需求持穩、產能如期出貨、增速數學性減速;CI 溫和去庫 | $30 × 26x | $780 (=TP) |
| BullBull | 25% | Scarcity persists to 2028, backlash resolves, CI soft landing; PG sustains 30%+稀缺延續到 2028、backlash 化解、CI 軟著陸;PG 維持 30%+ | $33 × 32x | $1,056 |
Probability-weighted value = 0.25×520 + 0.50×780 + 0.25×1,056 = $784. ◆ Anchor reconciliation: the canonical TP is the base-scenario formula, $30.00 × 26x = $780; the probability-weighted value of $784 differs by +0.5% — rounding-level agreement, no third anchor.
機率加權值 = 0.25×520 + 0.50×780 + 0.25×1,056 = $784。◆ 錨點對賬:正式 TP=基準情境公式 $30.00×26x=$780(canonical);機率加權 $784 與之相差 +0.5%,屬四捨五入級一致;無第三錨點。
To double from here ($1,753), FY28E adj EPS would need to reach roughly $44 — a three-year growth rate of +32% a year — on a 40x multiple. That's earnings beyond any target management has ever put a number on, at a multiple above even June 2026's peak — a path the company itself has never described. The other direction needs no new bad news at all: just reverting to the 10-year median multiple gets you to 18.5x × $30 = $555 (-37%). Compare "how much the best case could gain" (the upside tail) against "how much the worst case could lose" (the downside tail): upside +20% (the bull scenario's $1,056 target) against downside -41% (the bear scenario's $520 target) — the downside is roughly twice as large as the upside. That lopsidedness is what "negative skew" means: more room to fall than to rise.
股價要從現價翻倍($1,753),FY28E adj EPS 需達 ~$44(三年 CAGR +32%)且倍數站上 40 倍——這個盈餘超過管理層自己講過的任何目標,倍數也高於 2026 年 6 月的歷史高點,等於要走出一條公司自己都沒說過會走的路。反方向不需要任何新的壞消息就會發生:只要股價回到十年中位倍數(18.5 倍 × $30 = $555,-37%)。把「最好情境能漲多少(上尾)」跟「最壞情境會跌多少(下尾)」放在一起看:上尾 +20%(bull TP $1,056)對下尾 -41%(bear TP $520)——跌的空間比漲的空間大,大約是 2:1(這就是「負偏態」:往下的空間比往上大)。
Honesty note on the view: a $780 target implies -11.0%, just inside the "Avoid" band (worse than -10%) — one dollar of price movement would be enough to relabel this "Range-bound" instead. So this call doesn't depend on $780 being exactly right; it rests on the 2-to-1 downside skew above. What actually manages the position day to day are the invalidation triggers in the Playbook section below.
觀點的誠實註記:目標價 $780 隱含 -11.0%,剛好落在「迴避」這個帶的邊緣(低於 -10% 才算迴避)——股價只要動一塊錢,就可能被重新歸類成「區間」。所以這個判定,靠的不是「$780 這個數字算得多精準」,而是靠上面那個 2:1 的下跌空間比較大的結構;真正在管理這個部位的,是下面〈操作框架〉裡列出的失效條件。
How to read this: every row below is a promise made in advance — "if this specific number shows up later, here's what this analysis will do about it." That means a reader coming back in six months can check the record and see whether this analysis actually followed through.
讀法:下表每一列都是一個預先承諾——「如果到時候看到某個數字 → 本研究就會做某件事」。這讓半年後的讀者可以回來對答案,看本研究是不是說到做到。
| Timing時間 | Event事件 | Threshold → reaction門檻 → 反應 ◆ | Status狀態 |
|---|---|---|---|
| 2026-10 late2026-10 下旬 | 3Q26 earnings (date unannounced)3Q26 財報(日期未公告) | PG revenue YoY <+25% and backlog QoQ add <$5B → deceleration thesis confirmed, keep Avoid; backlog ≥$75B and PG re-accelerates ≥+35% → progress toward invalidation ①, view-upgrade reviewPG 營收 YoY <+25% 且 backlog 環比增幅 <$5B → 減速論驗證,維持迴避;backlog ≥$75B 且 PG 重新加速 ≥+35% → 失效條件① 觸發進度,觀點上調檢討 | speculative推測 |
| 2026-09 →2026-09 起 | Monarch 2GW deliveries begin (through 2027-08); 1.5GW medium-speed platform ships 4Q26Monarch 2GW 開始交付(至 2027-08);1.5GW 中速平台 4Q26 開始出貨 | 4Q26 PG revenue QoQ ≥+15% → capacity unlock on schedule, FY27 revenue estimate raised4Q26 PG 營收環比跳升 ≥+15% → 產能解鎖如期,FY27 營收估上修 | scheduled已排定 ✓ |
| 2027-01 late2027-01 下旬 | FY26 full-year + FY27 guidance (date speculative)FY26 全年 + FY27 指引(日期推測) | FY27 revenue guide ≥+10% and implied EPS ≥$33 → this analysis's deceleration thesis wrong, view-upgrade review; <+8% → base case confirmedFY27 營收指引 ≥+10% 且隱含 EPS ≥$33 → 本研究減速論錯誤,觀點上調;<+8% → 基準情境確認 | speculative推測 |
| 2027-07 area2027-07 前後 | NY moratorium expiry; state bill activityNY moratorium 屆滿;州法案動向 | A third state moratorium or a VA/NC/IN bill passes → bear scenario weight 25%→35% review第三州 moratorium 或 VA/NC/IN 立法通過 → bear 情境權重 25%→35% 檢討 | watch觀察 |
| 2027 | Competitor capacity lands (GEV 70-80 turbines/yr, Siemens $1B, MHI doubles)同業產能落地(GEV 70-80 台/年、Siemens $1B、MHI 翻倍) | WoodMac-tracked turbine pricing (now +195% vs 2019, projected $600/kW by end-2027) turns down → pricing-power inflection, bear scenario activatesWoodMac 追蹤之渦輪價格(現 +195% vs 2019,看 $600/kW at 2027 底)轉跌 → 定價權轉折,bear 情境啟動 | watch觀察 |
| 2027-06 | Routine dividend action例行股息調整 | Hike <8% → management-caution signal on 2027 cash flow增幅 <8% → 管理層對 2027 現金流轉保守的訊號 | speculative推測 |
| If not holding未持有 | ◆ Don't open a new position (opening a position, or "entering," just means starting to buy) at the current price. The story is real, but the price has already paid for it — wait until either the price backs off or the evidence changes.現在這個價格不建倉(建倉=開始買進)。故事是真的,但價格已經先付了——先等,等到價格讓步,或者等到證據讓步,兩個條件出現一個再說。 |
| If holding已持有 | ◆ Default move: trim to a core position (trimming just means selling part of the holding and keeping only a core stake). Why: the stock is already up +55% this year, so this locks in some of that gain — and July just showed it can drop -23.5% in a single month, so the swings are real. Hold-and-review condition: if Q3 2026 backlog reaches ≥$75B and PG growth speeds back up (invalidation trigger ① below), switch to holding and re-review the whole call.預設做法:減碼至核心部位(減碼=賣掉一部分持股,只留核心持股)。理由:股價今年已經漲了 +55%,先把獲利保護起來;而且 7 月才剛示範過單月能跌 -23.5%,波動不小。續抱條件:如果 3Q26 backlog 達到 ≥$75B、而且 PG 增速回升(對應下方失效條件①),就轉為續抱,重新檢討這個觀點。 |
| Entry zone進場區 | ◆ Under $700 (about 23.3x FY27E earnings, a 10% cushion below the target price) and the evidence has to hold up at the same time: no order cancellations at the ≥1GW scale, and the hyperscalers (Microsoft, Google, Amazon, Meta — the cloud giants building the data centers) haven't cut their capex (capital expenditure — the money they spend building plants and buying equipment) guidance. Both conditions are required together — price alone or evidence alone isn't enough. The 07-29 low of $782.71 never reached this zone.<$700(大約是 FY27E 獲利的 23.3 倍,比目標價低 10% 的安全緩衝)而且證據面也要同時成立:沒有出現 ≥1GW 等級的訂單取消、大型雲端業者(hyperscaler,指 Microsoft、Google、Amazon、Meta 這一級蓋資料中心的雲端巨頭)沒有調降資本支出(capex,蓋廠、買設備的錢)指引。價格和證據兩個條件都要滿足,缺一不可。7/29 的低點 $782.71 還沒跌到這個區間。 |
| Why not more aggressive為何不更激進(不放空) | ◆ Why not go further and short the stock (shorting = borrowing shares to sell now, betting the price falls, then buying them back cheaper later to return them)? Several reasons stack up: the $72B backlog is contracted — cancelling it triggers penalties and customers have already prepaid; earnings momentum is still strong (the stock gapped up +11% the day of the 08-04 earnings release, a live demonstration of how a short seller can get squeezed into buying back at a worse price); the Dow Jones index is "price-weighted" — a stock's dollar price, not the size of the company, decides how much it moves the index, so the higher CAT's price climbs, the more passive index funds are forced to buy it just to track the index; and there's no clean downside catalyst date inside this six-month window. That downside-heavy skew (more room to fall than rise) is a reason for a holder to trim — it isn't a reason for a short seller to bet on it.為什麼不更激進,比方說放空(放空=先跟別人借股票賣掉,賭它之後會跌,跌了再低價買回還給對方)?幾個理由疊在一起:$72B 的在手訂單是有契約的——取消要罰款、客戶還先付了訂金;財報動能還很強(8/4 財報公布當天股價跳漲 +11%,就是軋空風險的活生生示範——放空的人可能被迫用更高價格回補);道瓊指數是「股價加權」——股票的美元價格、而不是公司規模,決定它對指數的影響力,所以 CAT 股價越漲,被動追蹤指數的資金就越是不得不跟著買;而且未來六個月內,看不到一個明確的下行催化時間點。跌的空間比漲的空間大,是持有人「該減碼」的理由,不是空方「值得下注」的理由。 |
| Invalidation失效條件 | ◆ ① If Q3 2026 backlog hits ≥$75B and PG's filed revenue (filed revenue = the revenue actually shipped and booked into the financial statements, as opposed to orders still waiting in line) growth speeds back up to ≥+35% → capacity is unlocking while demand hasn't weakened at all, which means this analysis's deceleration thesis was wrong. ② If the 2027-01 FY27 guidance implies adj EPS ≥$33 → the structural story is beating the cycle math; this call needs an upgrade review.① 3Q26 backlog ≥$75B、而且 PG 財報認列營收(filed revenue,指真正出貨、記進財報的營收,不是還在排隊的訂單)增速回升到 ≥+35% → 代表產能解鎖了、需求卻沒有變弱,本研究「減速論」判斷錯誤。② 2027-01 公司給的 FY27 財測隱含 adj EPS ≥$33 → 代表結構性故事贏過了週期性邏輯,這個觀點要重新檢討上調。 |
What today's price is paying for: at $876.54, the stock trades at 36.8 times TTM (trailing twelve months — the last four quarters added together) adjusted earnings.
Run it against this analysis's own estimates and it's 33.1x for FY26, 29.2x for FY27.
CAT's own normal range from 2018-2024 ran only 12-19x ⚠ (a 10-year median of about 18.5x ⚠).
現在的價格在付什麼:現價 $876.54,等於 TTM(過去四季合計)調整後盈餘的 36.8 倍。
用本研究自己的估計去算,FY26 是 33.1 倍、FY27 是 29.2 倍。
而 CAT 自己 2018–2024 年的常態區間,只有 12–19 倍 ⚠(十年中位約 18.5 倍 ⚠)。
Put another way: the market has stopped treating CAT as a cyclical machinery maker and started pricing it like an AI power-infrastructure company.
There are only two ways to justify today's price — either pair the consensus earnings estimate with an expensive multiple, or pair this analysis's own (higher) earnings estimate with a bull-case multiple.
Either way, there's no cushion left if anything goes even slightly wrong — no margin of safety.
換句話說:市場已經不把 CAT 當成「機械循環股」看待,改用「AI 電力基建股」的方式在定價。
要說得通現在的價格,只有兩種算法——用市場共識的盈餘配上偏高的倍數,或用本研究自己(比較高)的盈餘估計配上牛市倍數。
不管哪一種算法,只要出現一點點差錯,都沒有緩衝空間——也就是沒有留任何安全邊際。
Even sell-side analysts are split down the middle on this one: before the Q2 earnings print, 28 analysts covering the stock ran roughly half "buy it," half "just hold it" (13 Strong Buy vs. 12 Hold) — average target price $963.56, ranging from a high of $1,218 to a low of $575 ✓.
Since that print, the only confirmed move is Oppenheimer raising its target from $1,105 to $1,118 ✓.
The most bearish named voice in the market is InvestingPro's fair-value model at $599.50 — implying -34.6% downside from here ✓.
The exact question that splits sell-side opinion is the one this page is trying to answer.
連賣方自己也分成兩派:Q2 財報前,追蹤這檔股票的 28 位分析師大約一半喊買、一半觀望(Strong Buy 13 位/Hold 12 位),平均目標價 $963.56,最高 $1,218、最低 $575 ✓。
財報後僅確認一筆動作:Oppenheimer 把目標價從 $1,105 上調到 $1,118 ✓。
市場上最悲觀的具名聲音,是 InvestingPro 的公允值模型,給出 $599.50(隱含現價還要再跌 -34.6%)✓。
讓賣方分裂成兩派的那個問題,正是本頁要回答的問題。
Bulls and bears are actually arguing about the same thing: the bulls say orders have piled up to $72B (+92%), and last quarter's earnings beat the estimate by 32% — demand is roaring.
The bears say several states have started blocking new data centers, and the stock is too expensive — demand is about to break.
Notice: both sides are arguing about whether demand keeps holding up.
This analysis's disagreement sits on a different axis. What actually decides who wins on this stock isn't demand — it's supply (whether the 2027-29 industrywide capacity wave lets the current shortage premium survive) and mix (AI power is only a small slice of this company; more than half of it is still an old-fashioned machinery cycle).
看多與看空的人,其實在吵同一件事:看多的人說:訂單堆到 $72B(年增 92%)、上一季獲利比預期高 32%——需求好得不得了。
看空的人說:好幾個州開始擋資料中心、股價也太貴——需求要出問題。
注意:兩邊吵的,都是「需求會不會繼續好」。
本研究的分歧在另一個軸上。決定這檔股票勝負的,不是需求,而是供給(2027–29 全行業新產能同時開出,供不應求的溢價還能不能撐住)與組合(AI 電力只是這家公司的一小塊,另一大半還是傳統機械的景氣循環)。
Three specific disagreements sit behind all this: the "waiting list, not growth engine" read of the backlog, the 15%-priced-as-100% mismatch between what's growing and what's being paid for, and the 2027-29 supply wall. Each is argued out in full, with its evidence, in the Variant perception section further down the page; the business, technology and moat chapters in between exist to explain the machinery those three arguments depend on. The landing spot, stated once here up front: the story is real, and the floor is higher than the bears think — but $876 has already paid for most of that structural story while paying no discount at all for the cyclical risk sitting underneath it. Over a six-month window, that's earnings momentum racing against multiple gravity — and gravity has the better odds.
背後其實是三個具體的分歧點:backlog 的「排隊名單,不是成長引擎」讀法、「正在成長的那一塊」跟「股價實際付錢的那一塊」之間 15%↔100% 的錯配、以及 2027-29 供給牆。三點各自完整論證、附上證據,都在下方〈變異認知〉章節;中間的事業、技術與護城河章節,是在解釋這三個論點運轉所需要的機理。落點在此先講一次:故事是真的、底部比空方想的高,但 $876 已經預付了結構故事的大部分,卻沒有為底下的週期性風險打任何折。六個月視角看,是盈餘動能在跟「倍數的重力」賽跑——後者的勝率略高一點。
Caterpillar is the world's largest maker of construction machinery, but by 2026 it is really a three-legged company:
Caterpillar 是全球最大工程機械製造商,但 2026 年的 CAT 已是三腳架:
Excavators, dozers, wheel loaders and the rest of the earthmoving line. FY25 revenue $25.060B (-2%, 37% of MP&E — "Machinery, Power & Energy," CAT's manufacturing businesses added together, not counting its financing arm) ✓ 10-K.
挖土機、推土機、裝載機等營建機械。FY25 營收 $25.060B(-2%,占 MP&E 的 37%——MP&E 是 CAT 製造業務的合計,不含它的金融服務部門)✓ 10-K。
Mining equipment (ultra-class haul trucks, electric rope shovels), plus rail (Progress Rail) and marine, folded in as of 2026-01-01. FY25 revenue $12.474B (flat, 18% of MP&E) ✓ 10-K.
礦業設備(超大型礦卡、電鏟)+ 2026-01-01 起併入的鐵路(Progress Rail)與船舶業務。FY25 營收 $12.474B(持平,占 MP&E 的 18%)✓ 10-K。
Renamed from Energy & Transportation on 2025-11-04. This is the segment that makes the big diesel/gas engines, Solar Turbines gas turbines, and generator sets. FY25 revenue $32.201B (+12%, 45% of MP&E — the largest of the three segments, under the old structure that still included transportation) ✓ 10-K.
2025-11-04 由 Energy & Transportation 更名而來,賣的是大型引擎、Solar Turbines 燃氣渦輪機、發電機組。FY25 營收 $32.201B(+12%,占 MP&E 的 45%,三段中最大;此為舊架構,仍含運輸業務)✓ 10-K。
The arm that finances equipment purchases for CAT's own customers. FY25 net revenue $3.609B ✓ 10-K.
幫 CAT 客戶買設備做融資的部門。FY25 淨營收 $3.609B ✓ 10-K。
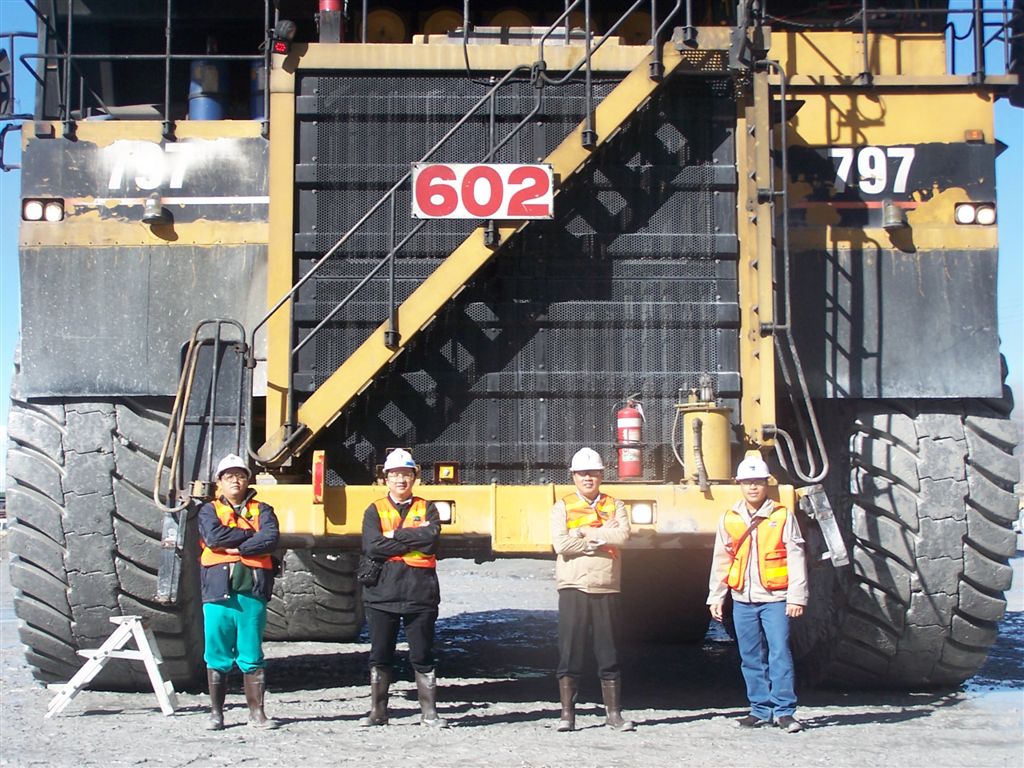
A Cat 797 ultra-class haul truck — "797" is marked on the rear body panels. Four mine workers in hi-vis gear and hard hats stand in front of the tires for scale. Photo: Dionisius Purba · CC BY 2.0 · Wikimedia Commons.Cat 797 超大型礦卡——車尾清楚標示「797」字樣,四名礦場工作人員站在巨大輪胎前,帶出真實尺寸感。圖:Dionisius Purba · CC BY 2.0 · Wikimedia Commons。
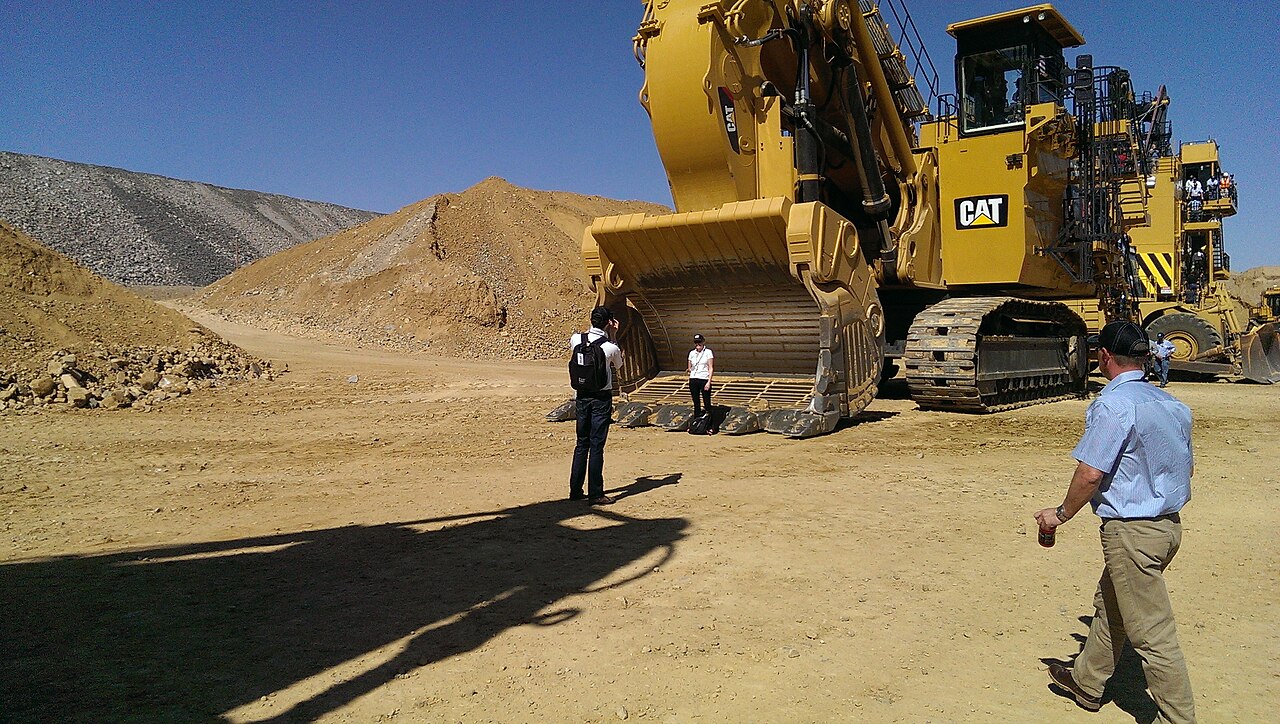
A Cat large hydraulic mining shovel at Caterpillar's Tinaja Hills demonstration & testing facility (Arizona) — the CAT badge is clearly visible on the machine body; a second haul truck sits in the background. Photo: MINING.com via Flickr · CC BY 2.0 · Wikimedia Commons.Cat 大型液壓礦用挖掘機,攝於 Caterpillar 位於亞利桑那州的 Tinaja Hills 示範測試場——CAT 標誌清楚可見,背景還有另一台礦卡。圖:MINING.com(Flickr)· CC BY 2.0 · Wikimedia Commons。
Here's the trap: CAT announced the P&E rename on 2025-11-04, and moved rail and marine into RI effective 2026-01-01. That means the FY25 10-K's P&E figure of $32.2B still includes transportation, but every 2026 quarterly P&E figure excludes it — the company even went back and restated the comparison periods under the new basis (1Q25 restated to $5.783B, 2Q25 to $7.037B). Read across the two: they're measuring different things, so they can't be compared directly ✓ Int'l Mining 2025-11-04 + 1Q/2Q26 releases.
這裡有個陷阱:CAT 在 2025-11-04 宣布 P&E 更名,並在 2026-01-01 起把鐵路與船舶業務移入 RI。這代表 FY25 10-K 裡的 P&E $32.2B 仍然含運輸業務,但 2026 年每一季的 P&E 數字都已經不含——公司甚至把比較期用新口徑重新編過(1Q25 重編為 $5.783B、2Q25 為 $7.037B)。這兩種數字量的東西不一樣,不可以直接拿來比 ✓ Int'l Mining 2025-11-04 + 1Q/2Q26 releases。
| Segment段別 | FY25 revenueFY25 營收 | % of MP&E占比 | YoY |
|---|---|---|---|
| Construction IndustriesConstruction Industries | $25.060B ✓ | 37% | -2% |
| Resource IndustriesResource Industries | $12.474B ✓ | 18% | 0% |
| Power & EnergyPower & Energy | $32.201B ✓ | 45% | +12% |
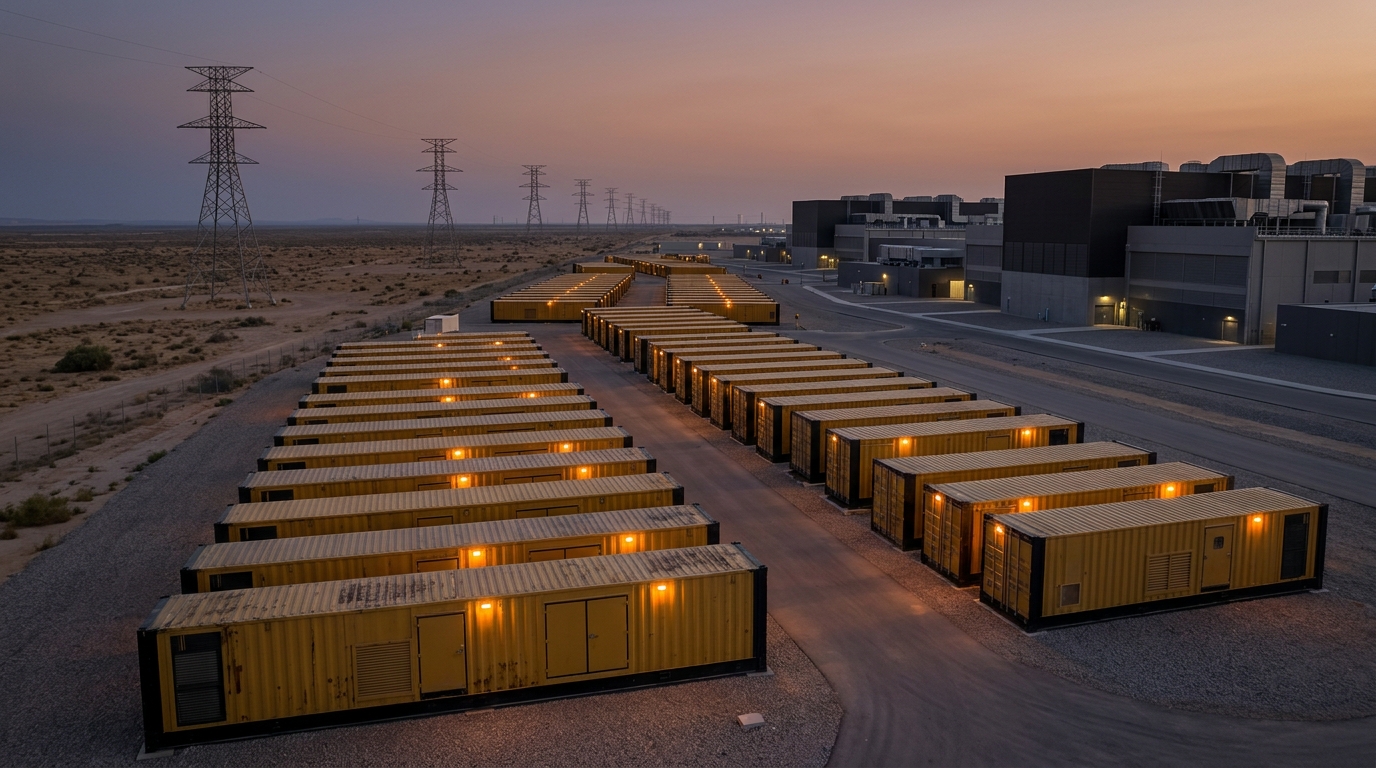
Diesel/gas piston engines (e.g. the 3512/3516, C175 families), roughly 1-4MW each, packaged as modular container-sized generator sets ("gensets"). Start time is seconds to minutes — the whole point is speed.
柴油/天然氣活塞引擎(如 3512/3516、C175 系列),單機約 1-4MW,模組化貨櫃式發電機組(genset)。快速起動(秒級-分鐘級)。
Industrial-class gas turbines (a few MW to tens of MW), efficient for continuous operation, also widely used in oil & gas for "gas compression" — pumping natural gas pipelines and LNG. The 2Q26 call flagged a 10MW medium-speed reciprocating platform coming back online (~1.5GW of restored capacity, shipping from 4Q26) ✓ transcript.
工業級燃氣輪機(數 MW-數十 MW),連續運轉效率高,亦大量用於油氣「氣體壓縮」(gas compression,天然氣管線/LNG 的幫浦)。2Q26 call:10MW 中速燃氣往復式平台復產,~1.5GW 產能重上線,4Q26 開始出貨 ✓ transcript。
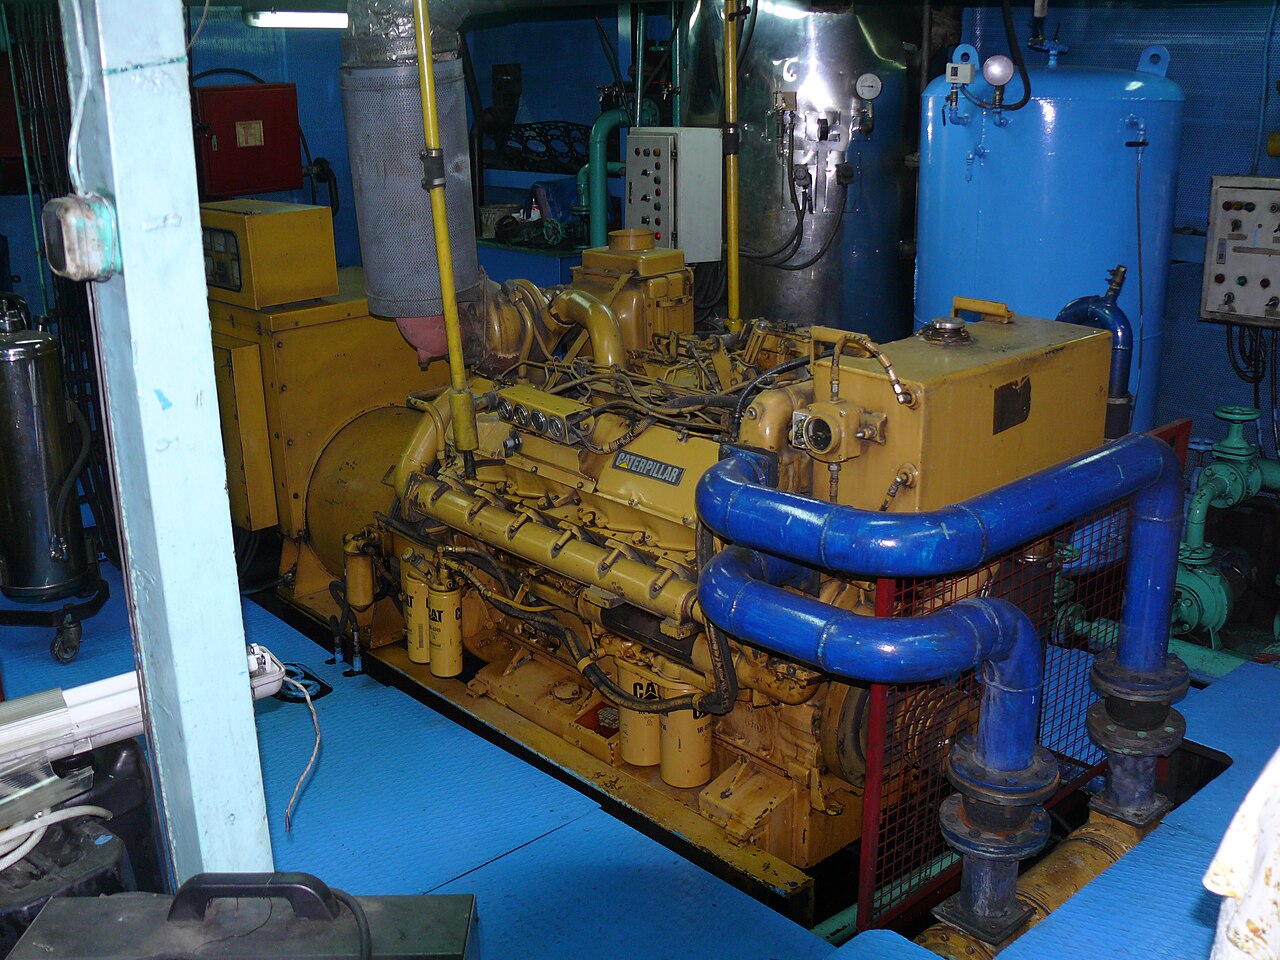
A real Caterpillar diesel engine in a ship's engine room — the CATERPILLAR nameplate sits on the block, and the yellow drum it drives on the left is a generator: engine + generator is literally what a "genset" is. The data-center machines this page discusses (3500/C175 series) are the same engine family, scaled up to room size. Photo: Ad Meskens · CC BY-SA 3.0 · Wikimedia Commons.船舶機艙裡的真實 Caterpillar 柴油引擎——機身上有 CATERPILLAR 銘牌,左側被它帶動的黃色圓筒就是發電機:「引擎+發電機」合在一起,就是所謂的發電機組(genset)。本頁討論的資料中心用機型(3500/C175 系列)是同一個引擎家族,再放大到一個房間的尺寸。圖:Ad Meskens · CC BY-SA 3.0 · Wikimedia Commons。
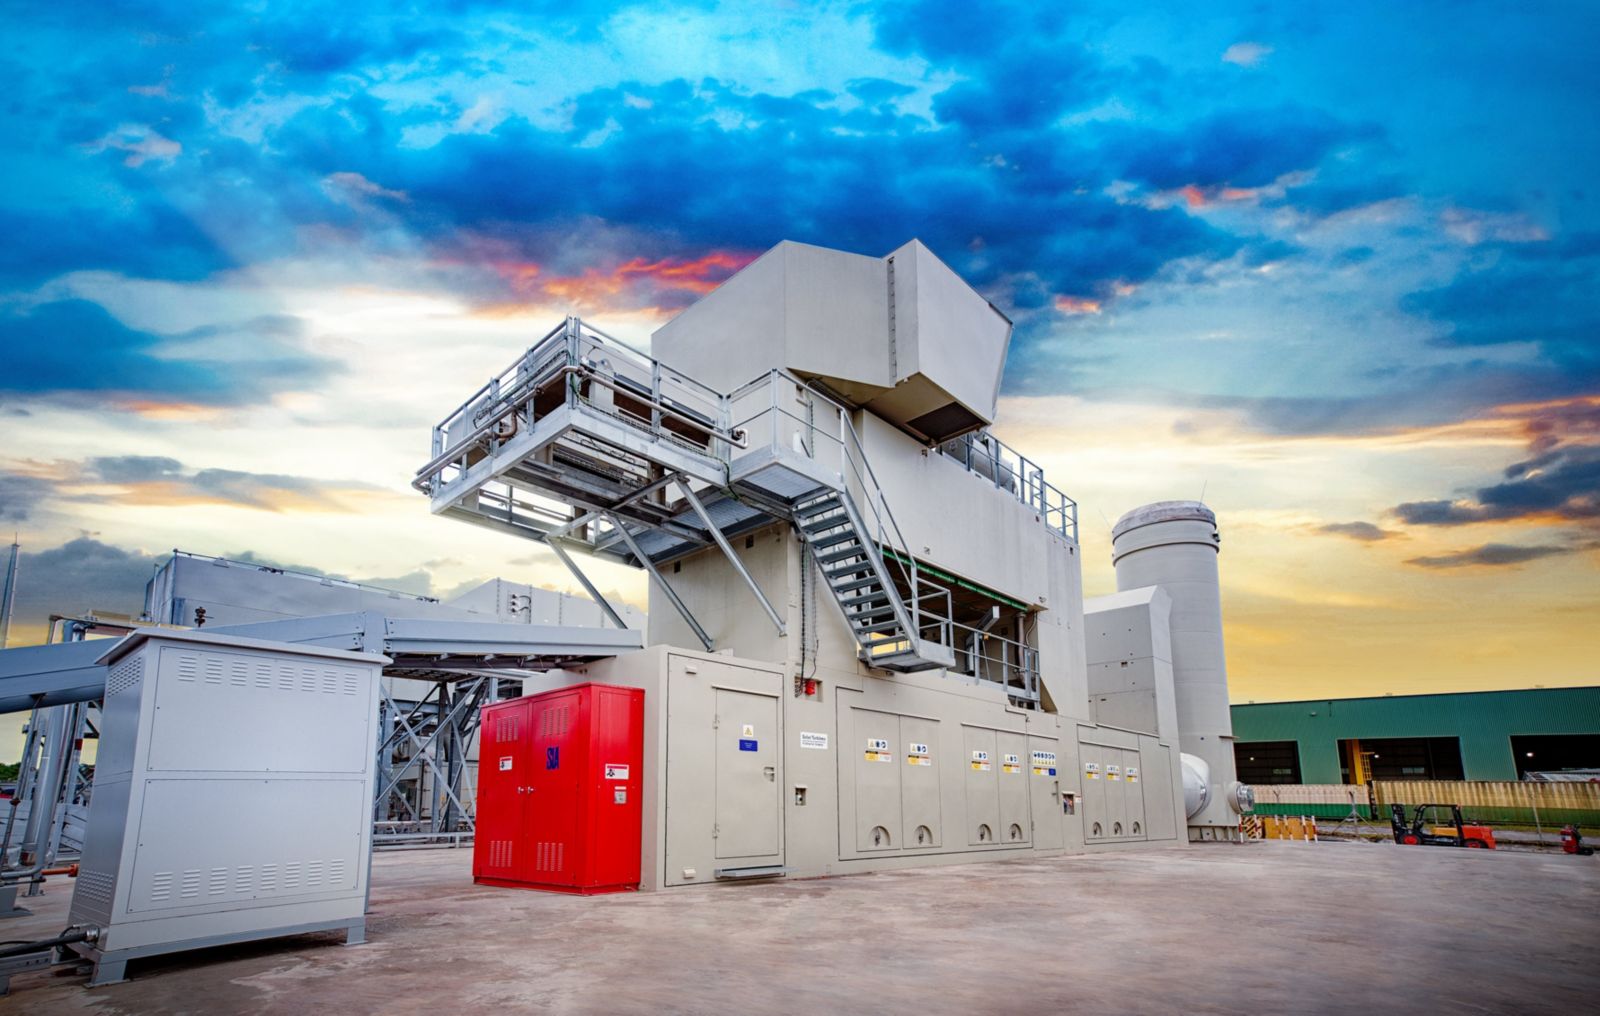
A real Solar Turbines gas turbine package on site — the "Solar Turbines" nameplate is visible on the enclosure. Photo: Solar Turbines / Caterpillar Inc. official website.真實的 Solar Turbines 燃氣渦輪機組安裝現場——機身面板上可見「Solar Turbines」字樣。圖:Solar Turbines / Caterpillar Inc. 官方網站。
Standby/backup power only starts when the grid fails — the N+1 redundancy layer every data center already carries as standard equipment. Prime power means running continuously as the primary source, for extended periods. Management has explicitly said the mix is shifting toward prime ("more mix towards prime," Q1'26 call ✓) — and backup demand isn't shrinking either. The precise prime/standby revenue split is not disclosed by the company.
standby/backup(備援)=停電才啟動,數據中心標配 N+1 冗餘。prime power(主力電源)=長時間持續供電,作為主要電源運轉。CAT 管理層明示 mix 正移向 prime(「more mix towards prime」,Q1'26 call ✓),backup 需求並未減少。精確的 prime/standby 營收拆分,公司未揭露。
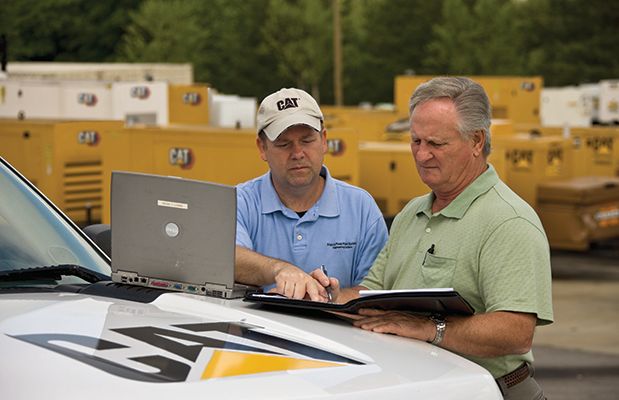
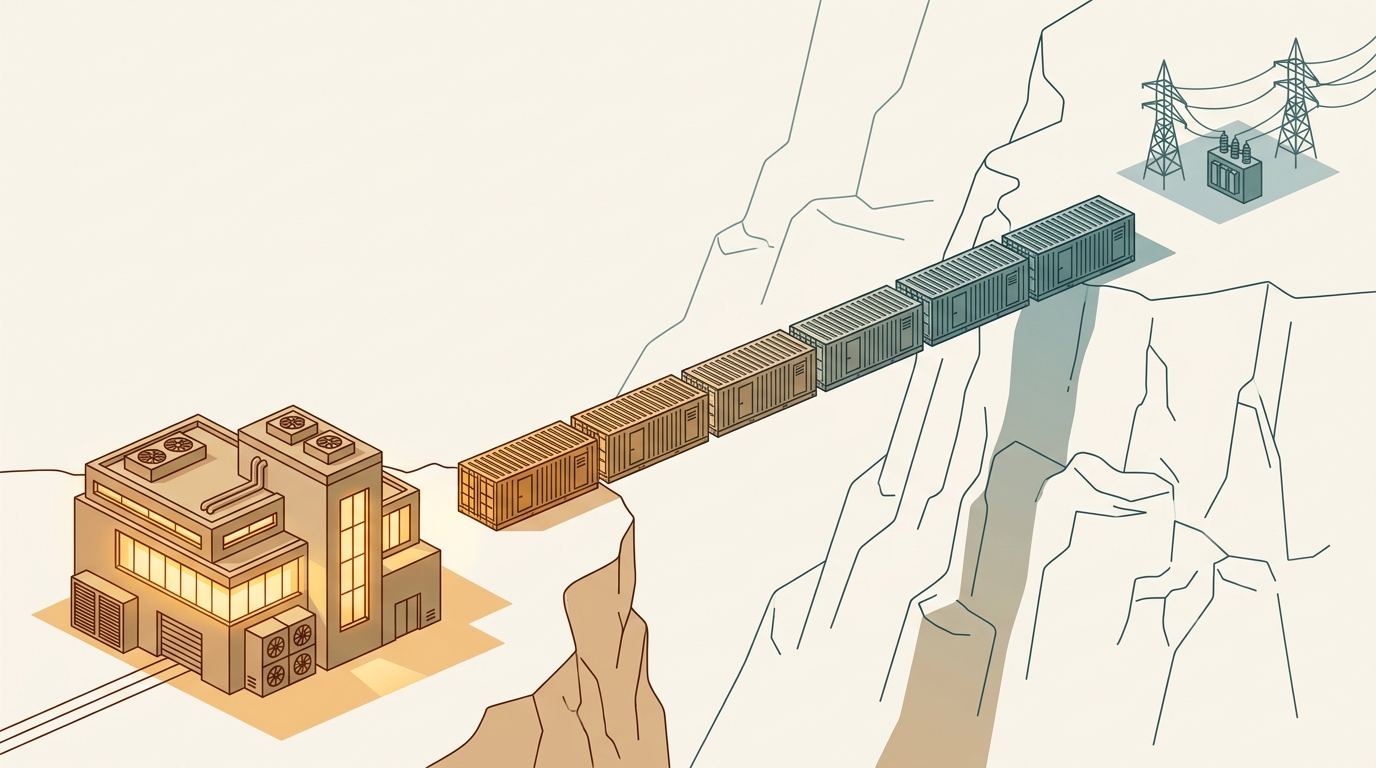
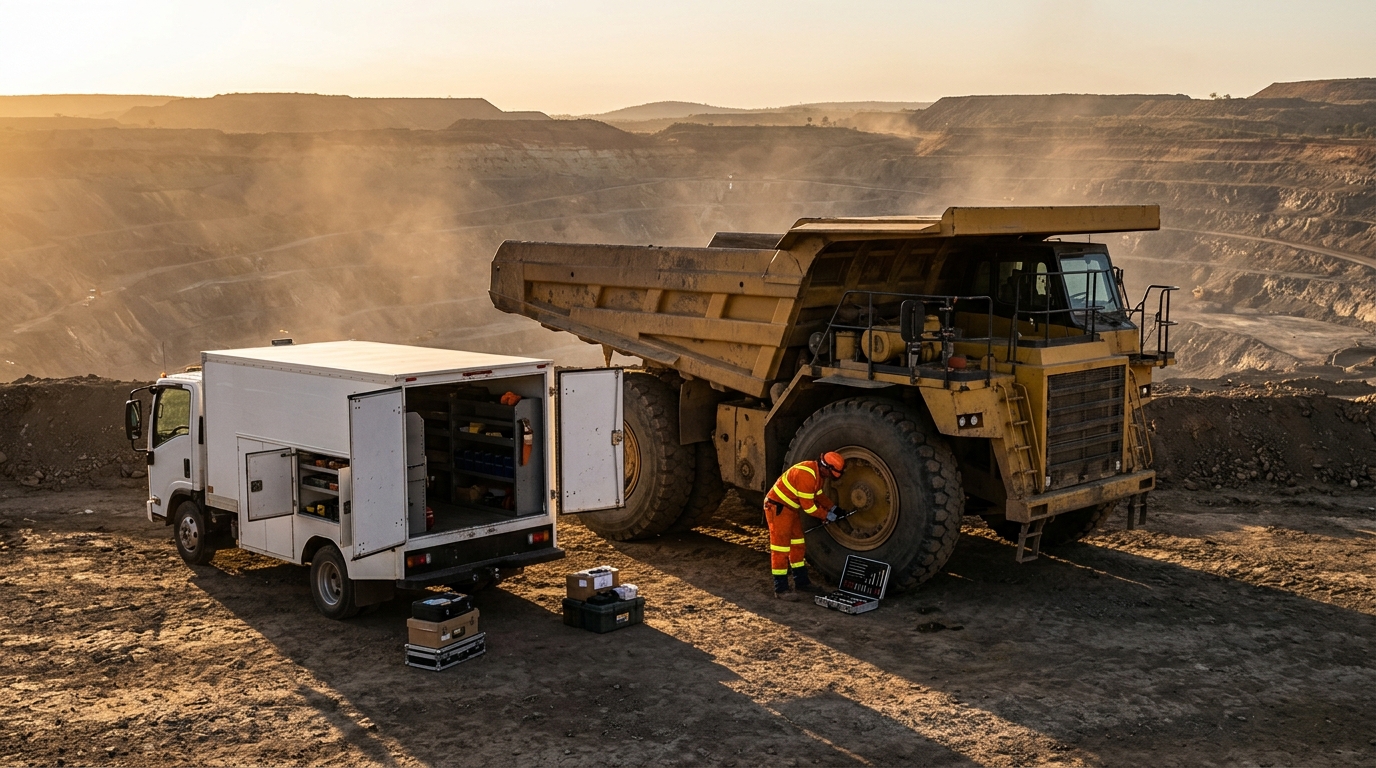
How it works: CAT has 156 independently-owned dealers (43 in the US, 113 elsewhere) covering 191 countries ✓ 10-K. When a mine or job site sits idle, that costs an enormous amount of money — so having spare parts on-site within 24-48 hours is the real thing that decides which brand a customer buys. Building that kind of network — the warehouses, the trucks, the trained technicians — took decades of investment competitors simply can't rent or copy overnight.
機制:CAT 有 156 家獨立經銷商(美國 43 家、海外 113 家),覆蓋 191 個國家 ✓ 10-K。礦場或工地一旦停機,成本極高——所以零件能不能在 24-48 小時內送到現場,才是客戶真正決定買哪個品牌的關鍵。要建出這種經銷商網絡——倉庫、車隊、受訓的技術人員——要花上數十年投資,競爭對手沒辦法用租的或一夕之間複製。
What could erode this: if electrification or autonomous machines end up needing less maintenance, that shrinks the service business this moat depends on; or a Chinese brand could undercut on price in emerging markets while building its own service network from scratch. What to watch: services revenue and market share (see below).
可能被侵蝕的路徑:如果電動化或自動化讓設備需要的維修變少,這個護城河靠的服務業務就會跟著萎縮;或者中國品牌用極低價格切入新興市場、同時自己蓋一套服務網。看什麼:services 營收與市占率(見下方)。
How it works: CAT's after-sale services revenue (parts, maintenance, repairs) grew from $14B in 2016 to $22B in 2023, to roughly $24B now (secondary sources disagree on whether that's the 2024 or 2025 figure ⚠). The company's own target is $28B by 2026 — it's currently behind pace, and hitting that looks doubtful, which this analysis says plainly — with $30B targeted by 2030. Every machine CAT sells keeps generating parts and service revenue for 20-30 years afterward, which smooths out the boom-and-bust swings of selling new equipment.
機制:CAT 的售後服務營收(零件、保養、維修)從 2016 年的 $14B 成長到 2023 年的 $22B,現在約 $24B(二手來源對這是 2024 還是 2025 年口徑講法不一 ⚠)。公司自己的目標是 2026 年 $28B——現在進度落後,能不能達標存疑,本研究在此直接講明;2030 年目標 $30B。每賣出一台設備,接下來 20-30 年都會持續產生零件與服務收入,這能撫平賣新設備本身的景氣波動。
How it works: only a handful of manufacturers worldwide (CAT, Cummins, mtu, Wärtsilä, INNIO) can deliver large engines at gigawatt scale. No named research firm publishes a market-share ranking, so this analysis states only the direction — "CAT #1, Cummins #2" — without putting a percentage on it ◆ not foundNOT FOUND. The supply chain for castings and forgings, the test-stand capacity, and the certification process all keep a new competitor at least 5 years away from being able to compete.
機制:全球能以 GW 級規模交付大型引擎的廠商只有一手之數(CAT、Cummins、mtu、Wärtsilä、INNIO)。沒有具名研究機構公布市占排名,本研究只能做方向性陳述——「CAT 第一、Cummins 第二」——不引用百分比(◆ NOT FOUND)。鑄鍛件供應鏈、測試台產能、認證流程,都讓新進者至少要 5 年才追得上。
What could erode this — and this is one of the pillars of the bear case: what's actually happening isn't new competitors showing up. It's the existing players collectively expanding capacity at the same time (see §What drives volume). A moat like this protects "CAT's share of the industry" — it does not protect "how much pricing power the whole industry gets to keep." Share and pricing power are two different things, and mixing them up is exactly where this analysis disagrees with the bulls.
可能被侵蝕的路徑(本研究的空方論點支柱之一):正在發生的其實不是新進者,而是既有廠商集體同時擴產(見「什麼會放量」)。這種護城河保護的是「CAT 在產業裡的份額」,不是「整個產業能留住多少定價權」。份額跟定價權是兩件事——把兩者搞混,正是本研究跟牛方分歧的地方。
How it works: roughly 690 autonomous haul trucks were running as of end-2024, with a target of 2,000+ by 2030; over 11 billion cumulative tonnes have been hauled by them ✓ International Mining 2025-11. MineStar, CAT's fleet-management software, locks customers in for a decade at a time; the RPMGlobal (2026-02) and Skycatch (2026-07) acquisitions fill out the software layer on top of that ✓.
機制:約 690 台自主礦卡在 2024 年底已上線,目標 2030 年前達 2,000 台以上;累計已運送超過 11 億噸 ✓ International Mining 2025-11。MineStar 車隊管理軟體讓客戶一綁就是十年;RPMGlobal(2026-02)與 Skycatch(2026-07)兩筆收購,補齊了這套軟體層 ✓。
| What to watch觀察什麼 | Where to check在哪查 | Current reading當前讀數 | Threshold → meaning門檻 → 意義 |
|---|---|---|---|
| GEV gas-turbine backlog & sold-out yearGEV 燃氣渦輪 backlog 與售罄年份 | gevernova.com (quarterly)(季報) | 116GW ✓ | Slot year stops extending / backlog QoQ flattens → turbine scarcity is fading, watch CAT P&E pricing power in parallelslot 年份不再外推/backlog 環比轉平 → 渦輪稀缺退潮,CAT P&E 定價權同步觀察 |
| GEM BTM gas-power trackerGlobal Energy Monitor BTM 氣電追蹤 | globalenergymonitor.org (irregular)(不定期) | ~101GW ✓ | Announcement pace turns negative → bridge-power demand peaking signal公告增速轉負 → bridge-power 需求見頂訊號 |
| State-level data-center legislation州級資料中心立法 | DLA Piper and similar legal alerts等 legal alerts | Maine ban (04); NY ≥50MW 1yr moratorium (07-14 EO)Maine 禁令(04);NY ≥50MW 一年 moratorium(07-14 EO) ✓ | A third state moratorium → bear-scenario weight raised第三個州級 moratorium → bear 情境權重上調 |
| Hyperscaler capex guidanceHyperscaler capex 指引 | MSFT/GOOGL/AMZN/META quarterly callsMSFT/GOOGL/AMZN/META 季度 call | >$650B (2026) ✓ | Two or more houses cut guidance → upstream demand turns兩家以上下修 → 需求上游轉向 |
| N. America non-residential construction北美非住宅營建 | AIA / Census (monthly)(月頻) | -7% YTD nonres, -9.6% mfg plants ✓ | Infrastructure (+5-7%) turns negative → CI loses its last support基建(+5-7%)轉負 → CI 失去最後支撐 |
| China excavator monthly sales中國挖機月銷 | CCMA (monthly, ~10th of next month)(月頻,~次月 10 日) | H1'26 domestic +20.4% but export/subsidy-driven; property investment -18%H1'26 內銷 +20.4% 但屬出口/補貼驅動;地產投資 -18% ✓ | Domestic sales turn negative → global machinery cycle downturn confirmed內銷轉負 → 全球機械週期下行確認 |
| Power GenerationPower Generation | YoY | Oil & GasOil & Gas | YoY | IndustrialIndustrial | YoY | |
|---|---|---|---|---|---|---|
| 1Q26 | $2.817B ✓ | +41% | $1.423B ✓ | +13% | $1.473B ✓ | +5% |
| 2Q26 | $3.098B ✓ | +29% | $2.044B ✓ | +9% | $1.653B ✓ | +9% |
Doing the division for the first half of 2026: Oil & Gas $3.467B ÷ total P&E revenue $15.269B = 22.7% of the segment (this analysis's own arithmetic — a secondhand "29% of segment" figure floating around elsewhere is dropped as unreliable). For the full year 2025, Power Generation ran above $10B, growing over 30% (per the Q4'25 call, ⚠ not cross-checked line-by-line against the 10-K table). Old-basis reference numbers (second half of 2025): Q3'25 PG $2.634B +31%, Q4'25 PG $3.238B +44% ✓.
算一下 2026 上半年:油氣(O&G)$3.467B ÷ P&E 總營收 $15.269B = 22.7%(本研究自己算的;坊間流傳的「29% of segment」二手數字不可靠,棄用)。FY25 全年 Power Generation 營收超過 $10B,成長超過 30%(Q4'25 法說會口徑,⚠ 未經 10-K 表格逐項確認)。舊口徑參考(2025 下半年):3Q25 PG $2.634B +31%、4Q25 PG $3.238B +44% ✓。
Here's what CAT itself is doing about the bottleneck above — three separate expansions, all confirmed on earnings calls or in press releases ✓:
面對上面那個產能瓶頸,CAT 自己在做的事——三項擴產計畫,都出自法說會或新聞稿 ✓:
Raised at the Q1'26 call ✓. Completion adds 15GW of capacity a year; capex is concentrated mainly in 2027-2029 ✓ transcript.
Q1'26 法說會上修 ✓。完工後每年多出 15GW 供給能力;資本支出主要落在 2027–2029 ✓ transcript。
Solar Turbines production-line expansion ✓; the Lafayette, IN plant investment is $725M ✓ Manufacturing Dive.
Solar Turbines 產線擴建 ✓;Lafayette, IN 廠投資 $725M ✓ Manufacturing Dive。
The 10MW medium-speed model is restarting its production line, shipping as early as 4Q26 ✓ transcript — no need to wait for 2027, this is the earliest capacity unlock this analysis can actually see.
10MW 中速機型重啟產線,4Q26 即開始出貨 ✓ transcript——不用等 2027,是最早看得到的產能解鎖。
| Company公司 | Niche利基 | Key data關鍵數據 | Source, date來源年月 |
|---|---|---|---|
| GE Vernova (GEV)GE Vernova(GEV) | Gas turbines燃氣渦輪 | Backlog 116GW, "mostly sold out through 2030"; expects ≥125GW booked by end-2026; over half of 2031 slots already contractedbacklog 116GW,「mostly sold out through 2030」;預期 2026 年底 ≥125GW 在約;2031 slot 已逾半數契約化 | ✓ 2Q26 transcript, 2026-07-22 |
| Siemens Energy | Gas turbines燃氣渦輪 | Backlog ~60GW, booked through FY28, a 4-year waitbacklog ~60GW,訂單排至 FY28,四年等待期 | ✓ S&P Global, 2026-06-30 |
| Mitsubishi Heavy Industries (MHI)三菱重工(MHI) | Gas turbines燃氣渦輪 | Backlog ¥3.6T (+40%); largest turbines wait up to 7 years; capacity doubling within two yearsbacklog ¥3.6T(+40%);大型渦輪等待最長 7 年;兩年內產能翻倍 | ✓ DCD |
| Cummins (CMI) | Reciprocating engines / gensets往復式引擎/發電機組 | $150M Minnesota expansion + a Circe Energy Texas data-center gas-supply order明尼蘇達 $150M 擴產+Circe Energy 德州資料中心供氣機組 | ✓ Cummins PR, 2026-06-16 |
| Wärtsilä | Reciprocating engines / gensets往復式引擎/發電機組 | >2.4GW cumulative US data-center orders; one Texas order at 790MW美國資料中心累計 >2.4GW;790MW 德州單 | ✓ Wärtsilä PR, 2026-04-23 |
| Rolls-Royce (RR) mtuRolls-Royce(RR)mtu | Backup gensets備援 genset | Claims backup coverage of >25% of US data centers; Mankato plant capacity doubling自稱備援系統覆蓋 >25% 美國資料中心;Mankato 廠倍增產能 | ✓ Rolls-Royce PR |
The industry bottleneck, in one line: global gas-turbine orders currently run around 110GW, but manufacturers can only build 60-70GW a year — so the wait to get a turbine is 6 years, prices have already risen 195% since 2019, and the projection is $600/kW by end-2027. This is the single heaviest industry number this analysis leans on ✓ Wood Mackenzie, 2026-04-01.
產業瓶頸,一句話講完:全球燃氣渦輪訂單現在約 110GW,但廠商一年只造得出 60-70GW——所以等一台渦輪機要等 6 年,價格自 2019 年以來已經漲了 195%,看向 2027 年底可能到 $600/kW。這是本研究引用份量最重的一顆產業數字 ✓ Wood Mackenzie, 2026-04-01。
Backlog stands at $72B — up 92% year-over-year, up $9B just from last quarter, and 59% of it converts into revenue within 12 months ✓ call.
Orders are already booked out to 2030.
Management's own words: "no customers are slowing down on AI demand" ✓.
Contracts reportedly carry cancellation penalties and require prepayment, which makes that backlog harder to walk away from (⚠ secondhand call paraphrase, not verified word-for-word).
在手訂單(backlog)來到 $72B——年增 92%,光是上一季就多了 $9B,其中 59% 會在 12 個月內轉成營收 ✓ call。
訂單已經排到 2030 年。
管理層自己講的原話:「沒有客戶在 AI 需求上放緩」✓。
據轉述,這些合約含取消罰則、還要求預先付款,讓客戶更難臨時抽單(⚠ 二手轉述 call 語句,未逐字核對)。
Revenue hit $20.543B (+24%, the first quarter ever above $20B), adjusted EPS was $8.17 (+73% year-over-year), adjusted operating margin was 21.9% (+430 basis points) ✓.
The catch: $392M of that came from a one-time IEEPA tariff refund (✓ release p.4, about $0.65 per share after tax).
Strip that out and the beat is still large, but the margin gain shrinks — and management's own guidance says that excluding these one-time recoveries, full-year margin lands at the low end of its target range.
營收來到 $20.543B(+24%,史上首度單季超過 $20B)、調整後每股盈餘 $8.17(年增 73%)、調整後營益率 21.9%(+430 個基點)✓。
但要留意:其中 $392M 是一次性的 IEEPA 關稅回收(✓ release p.4,稅後約合每股 $0.65)。
剔除這筆之後,超預期的幅度仍然很大,但變小了——管理層自己的財測也講明,排除這些一次性回收,全年 margin 會落在目標區間的下緣。
New capacity is coming online at +15GW a year, against a grid bottleneck that's still running 5+ years long — meaning CAT's shipment ceiling gets raised gradually, not all at once.
The 1.5GW medium-speed platform is the first piece, already contributing revenue in Q4 2026.
新產能以每年 +15GW 的速度上線,對上還要排隊 5 年以上的電網瓶頸——代表 CAT 的出貨天花板是逐步墊高,不是一次到位。
1.5GW 中速平台是第一塊拼圖,2026 年第四季就開始貢獻營收。
FY26 tariff guidance keeps getting cut: $2.6B → $2.2-2.4B → now roughly $2.2B ✓.
FY25's actual tariff cost was about $1.8B (worked out from the 10-K ✓; the earnings call itself quoted $1.7B ⚠, a $100M gap that's never been resolved).
2025's margin got squeezed from 20.7% down to 17.2% because of tariffs — and that squeeze is now unwinding. Part of FY26's earnings growth is simply tariffs rolling off, not pure demand strength.
FY26 關稅財測一路被下修:$2.6B → $2.2-2.4B → 現在約 $2.2B ✓。
FY25 實際付出的關稅約 $1.8B(用 10-K 資料推算 ✓;法說會本身講的是 $1.7B ⚠,中間差 $100M 一直沒解開)。
2025 年 margin 因為關稅被壓縮,從 20.7% 掉到 17.2%——現在這個壓縮正在回補。FY26 盈餘成長有一部分,其實是關稅退場,不是純粹的需求變強。
FY25 alone: $5.19B in stock buybacks plus $2.75B in dividends.
2026 H1 buybacks already hit $6.52B, including a $4.5B ASR — accelerated share repurchase, a deal where CAT pays a bank upfront for a big block of shares delivered over time, shrinking the share count faster than buying on the open market ✓.
Dividends have now risen for 32 straight years ✓.
光 FY25 一年:股票買回 $5.19B、加上股息 $2.75B。
2026 上半年買回已經到 $6.52B,其中含 $4.5B 的 ASR(加速買回——CAT 先付一筆錢給銀行買下一大批股票、分批交割,比在公開市場上慢慢買,能更快壓縮在外流通股數)✓。
股息已經連續調升 32 年 ✓。
Held with equal weight against the bull case above.
與上方多方論點同等權重。
The stock trades at 36.8x trailing earnings, against its own 10-year median of 18.45x — roughly double.
CAT's last "structural story" was the 2012 mining supercycle, when investors also believed a permanent boom justified a higher price. What actually happened: revenue fell 41.5% ($65.9B→$38.5B), it took 11 years just to get back to that 2012 peak, and EPS went negative in 2016 ✓.
Here's why that matters for the multiple specifically: near the top of a cycle, investors are usually most optimistic and most willing to pay a rich multiple — but that's also exactly when earnings are about to fall. So when the cycle turns, two things happen at once: earnings drop, and investors stop being willing to pay a rich multiple for those now-falling earnings. A smaller number times a smaller multiplier means the stock falls harder than either change alone would suggest — that's what "earnings and the multiple compress together" means, and it's why multiples are usually lowest right around the point a cycle actually bottoms.
July already gave a preview: the stock fell 23.5% in a single month, its worst month since 2009.
股價現在是過去一年獲利的 36.8 倍,對比自己過去十年的中位數 18.45 倍——大約是兩倍。
CAT 上一次講「結構性故事」是 2012 年的礦業超級週期,當時投資人也相信「永久性的榮景」值得付更高的價格。結果後來發生的是:營收掉了 41.5%($65.9B→$38.5B)、花了 11 年才回到 2012 年的峰值、2016 年 EPS 甚至轉負 ✓。
這裡解釋一下為什麼倍數特別重要:景氣循環接近頂點的時候,投資人通常最樂觀、最願意付高倍數——但這剛好也是獲利即將開始下滑的時間點。所以循環一轉向,兩件事會同時發生:獲利下滑,加上投資人不再願意為(正在下滑的)獲利付高倍數。一個變小的數字乘上一個變小的倍數,股價跌的幅度會比單獨看任何一個都更兇——這就是「盈餘與倍數雙殺」的意思,也是為什麼倍數通常在循環真正見底的那一刻最低。
7 月已經先預演過一次:單月下跌 23.5%,是 2009 年以來最差的一個月。
Construction Industries' +35% growth in Q2 leaned heavily on dealer restocking — dealer inventory rose $400M this quarter, versus a decline in the same quarter last year — plus extra loading into rental fleets.
Management itself has already guided a $1B+ dealer-inventory drawdown for Q4'26 ✓ call. That means the second half will see sell-in (what CAT ships to dealers) run below sell-through (what dealers actually sell to end customers) — the opposite of what just happened in Q2.
The broader backdrop isn't encouraging either: North American manufacturing-plant investment is down 9.6% (a classic late-cycle signal ✓), non-residential construction is down 7% year-to-date; China's property investment is down 18% and new construction starts down 23.4% (China's excavator sales growth is entirely propped up by exports and subsidies, not domestic demand ✓).
In Resource Industries: mining capex is growing only selectively (+3.8%, concentrated in copper and gold projects), and Q1 profit there fell 39%, with margin down to 10.0%.
In Oil & Gas: upstream capex has fallen for two straight years, offshore spending is down 24% ✓ Clarksons — CAT's own O&G business is currently propped up by gas compression and LNG work, by management's own framing ✓, not by drilling activity.
Construction Industries 第二季 +35% 的成長,有一大部分是靠經銷商回補墊出來的——這一季經銷商庫存增加了 $400M,去年同期反而是減少——再加上租賃車隊的裝載墊高。
管理層自己已經預告 Q4'26 要把經銷商庫存降 $1B 以上(✓ call)。這代表下半年的 sell-in(CAT 出貨給經銷商的量)會低於 sell-through(經銷商實際賣給終端客戶的量)——跟剛剛發生的 Q2 正好相反。
大環境也不樂觀:北美製造業廠房投資 -9.6%(典型的晚週期訊號 ✓)、非住宅營建年初至今 -7%;中國地產投資 -18%、新開工 -23.4%(中國挖機銷售的成長,全靠出口和補貼撐著,不是內需 ✓)。
Resource Industries:礦業資本支出只有選擇性成長(+3.8%,集中在銅、金專案),第一季利潤掉了 39%,margin 只剩 10.0%。
油氣:上游資本支出已經連兩年下滑,離岸支出 -24%(✓ Clarksons)——CAT 自己的油氣業務目前靠氣體壓縮與 LNG 撐著(管理層自己的講法 ✓),不是靠鑽井。
Around 75 projects worth $130B were delayed or blocked locally in Q1'26; Maine passed an outright ban; New York issued a one-year moratorium on data centers 50MW and up (Governor Hochul's 2026-07-14 executive order) ✓.
Sightline Climate estimates 30-50% of planned 2026 projects are at risk of delay or cancellation (⚠ original report not located, secondhand); in Q1 alone, 20+ projects worth $41.7B and 3.5GW were reportedly cancelled (⚠ same caveat).
Baird downgraded the stock to Neutral on 2026-07-29, cutting its target price from $1,200 to $900 ✓.
Q1'26 有大約 75 個專案、總值 $130B 在地方層級被延宕或封殺;Maine 州直接立法禁止;紐約州對 50MW 以上的資料中心發布一年期暫停令(州長 Hochul 2026-07-14 的行政命令)✓。
Sightline Climate 估計 2026 年規劃中的專案有 30-50% 有延後或取消的風險(⚠ 找不到原始報告,二手轉述);光 Q1 就有 20 多個專案、總值 $41.7B、3.5GW 被取消(⚠ 同樣是二手轉述)。
Baird 在 2026-07-29 把評等降為 Neutral,目標價從 $1,200 砍到 $900 ✓。
CAT's own new capacity lands in 2027-29 — exactly the same window when GE Vernova, Siemens, Mitsubishi Heavy Industries, Cummins, Wärtsilä and mtu are all landing new capacity too (every one of them named in §What drives volume above).
After a 195% run-up in turbine prices, the risk of prices simply reverting back toward normal is real: today's shortage premium is largely a 2025-26 phenomenon, and 2028 is a plausible year for the industry to tip into oversupply instead.
What the market is afraid of ("AI demand disappears") is different from what this analysis is afraid of ("pricing just goes back to normal") — and the second one doesn't need AI spending to slow down at all to happen.
CAT 自家新產能落地的時間點是 2027-29——恰好跟 GE Vernova、Siemens、三菱重工、Cummins、Wärtsilä、mtu 全部新產能落地的窗口重疊(每一家都在上面「什麼會放量」章節具名列出)。
渦輪機價格已經漲了 195% 之後,價格單純回歸正常的風險是真實存在的:現在的稀缺溢價很大程度上是 2025-26 年的特殊現象,2028 年很可能是整個產業轉向供給過剩的一年。
市場害怕的(「AI 需求消失」)跟本研究害怕的(「定價回歸正常」)是兩件不同的事——後者根本不需要 AI 支出放緩就會發生。
The bears' single biggest fear deserves its own walk-through: "will the state-level backlash kill demand?"
The company's answer is blunt: "no customers are slowing down" (Q2'26 call). But of course the company would say that — so put its claim aside and look at what third parties can verify.
What the third-party evidence shows: the real chokepoint for data-center power isn't "will states approve the construction" — it's "even a finished data center can't plug into the grid," because the interconnection queue (the wait list to connect to the public grid) now runs 5+ years ✓ GEM. That changes the meaning of a moratorium: it pushes demand later, it doesn't erase it. And a blocked grid connection is exactly what makes a data center buy its own on-site generators instead — so in the near term, the backlash arguably helps CAT's genset business rather than hurting it.
Where this analysis lands: Baird's downgrade points in a defensible direction — demand getting delayed just as new capacity arrives — but it aims at the wrong side of the story. Demand is more resilient than the bears assume; the genuinely unavoidable problem is on the supply side, where the whole industry's new capacity lands together in 2027-29. That is the blow that actually hurts the stock.
空方最大的恐懼,值得單獨拆開來檢查:「州政府的反彈,會不會殺死需求?」
公司的回答很直接:「沒有任何客戶在放緩」(2Q26 法說會)。但公司當然會這樣講——所以先把公司說法放一邊,看第三方查得到的證據。
第三方證據說的是:資料中心缺電的真正卡點,不是「州政府准不准蓋」,而是「蓋好了也接不上電網」——併網排隊(要連上公共電網的等候名單)現在要等 5 年以上 ✓ GEM。這會改變暫停令的意義:它是把需求「往後推」,不是把需求「消滅」。而且正因為電網接不上,資料中心才更要買自己的發電機組——所以短期內,反彈對 CAT 的 genset 生意反而可能是幫忙,不是傷害。
本研究的落點:Baird 降評的方向站得住腳——需求延後、剛好撞上新產能開出——但它打錯了邊。需求端其實比空方想的有韌性;真正躲不掉的問題在供給端:2027-29 全行業新產能一起開出來。會真正傷到股價的,是這一刀。
CEO Joe Creed took office 2025-05-01 and added the chairman title on 2026-04-01 ✓ — he has never had to run this company through a downturn.
The services revenue target of $28B by 2026 (see §Moat) looks very likely to be missed — the current run rate is only around $24B (⚠ which exact year that figure applies to isn't confirmed across sources).
CEO Joe Creed 2025-05-01 上任、2026-04-01 起兼任董事長 ✓——他從來沒有帶著這家公司走過一次下行週期。
services 營收 2026 年 $28B 的目標(詳護城河章節)看起來很可能落空——現在的水準只有約 $24B(⚠ 這個數字對應哪一個年度,來源之間講法不一致)。
Both the bulls (pointing to backlog +92%, a 32% earnings beat, "no slowdown") and the bears (pointing to backlash, moratoria, valuation) are arguing about demand. This analysis disagrees with both sides on a different axis entirely:
牛方(拿 backlog +92%、beat +32%、「no slowdown」當理由)與熊方(拿 backlash、moratoria、估值當理由)吵的都是需求。本研究跟雙方的分歧,在完全不同的一個軸上:
Shipped-revenue growth has fallen three quarters running: +44% → +41% → +29%.
Demand for the same quarter (sales-to-users) ran +72%, and lead times have stretched to 2028-29.
Orders are piling up because CAT can't ship them — not because demand keeps accelerating.
Three checkable pieces of evidence that this is a shipping constraint, not accelerating demand: (1) the scissors in the filed numbers themselves — delivered-and-booked revenue growth slowing three straight quarters while end-user deliveries grew +72% (the scarcity-ledger chart above ✓); (2) the delivery dates CAT quotes its customers — turbines into 2H 2028-2029, diesel gensets into 2028 (✓ 2Q26 call); (3) management's own words on the call: "no one is slowing down at the moment. In fact, if we can get more units out, they're asking us to give them more units" (✓ 2Q26 call transcript).
Once the whole industry's 2027-29 capacity wave lands, the queue starts clearing — backlog growth mean-reverting is a mechanical certainty, and it needs no bad news on the demand side at all.
At that point, the "+92%" narrative fuel runs out on its own.
出貨端增速連三季往下:+44% → +41% → +29%。
同一季的終端需求(sales-to-users)卻是 +72%,交期排到 2028–29。
訂單堆成山,是因為出不了貨,不是需求還在加速。
「出不了貨」的證據有三個,都查得到:①財報數字本身的剪刀差——真正交貨認列的營收增速連三季下滑,終端拿到貨的量卻年增 72%(見上方稀缺性帳本圖 ✓);②公司報給客戶的交期——渦輪機已排到 2028 下半年–2029、柴油機組排到 2028(✓ 2Q26 法說會);③管理層在法說會的原話:「現在沒有人在放緩。老實說,只要我們能多出貨,客戶就會要我們給更多機組」(✓ 2Q26 法說會逐字)。
2027–29 全行業產能齊發之後,隊列開始消化——backlog 增速回落是機制上的必然,不需要任何需求端的壞消息。
到時候「+92%」這個敘事燃料,自己就會熄火。
Power Generation runs roughly $12B annualized — just 15% of company revenue; the whole P&E segment is only 45%.
The other 55-58% (construction + mining) is standing at a sell-in peak — Q2's +35% leaned on dealer restocking, and management itself has already guided a $1B+ drawdown for Q4.
The 36.8x company-wide multiple carries the illusion that "the whole company is P&E."
Power Generation 年化約 $12B,只佔公司營收 15%;整個 P&E 部門也只佔 45%。
另外那 55–58%(營建+礦業)正站在 sell-in 高點——Q2 的 +35% 有經銷商回補墊高,Q4 公司自己就指引要去庫 $1B 以上。
36.8 倍的整體倍數,隱含「全公司都是 P&E」的錯覺。
Backlash kills the timeline, not the total — the real constraint is the 5+ year interconnection queue.
In the near term, behind-the-meter self-generation is actually the workaround for grid delay, so genset demand may even benefit.
So the near-term downgrade risk is smaller than bears think; but the 2027-28 "supply wall" is harder to dodge than the bears' "demand wall" — it arrives without needing a single piece of bad news.
Backlash 殺的是時程,不是總量——真正的約束是 5 年以上的併網隊列。
短期內,自備電(BTM)反而是繞過電網延遲的解法,genset 需求甚至受益。
所以近幾個月的下修風險,比熊方想的小;但 2027–28 的「供給牆」比熊方講的「需求牆」更難躲——它不需要任何壞消息就會到。
The story is real: the structural power gap exists, and CAT is genuinely positioned inside it — the floor is higher than bears think.
But $876 has already paid for most of the structural story, with no discount at all for cyclical risk.
Six-month view: earnings momentum against multiple gravity — gravity has the slightly better odds.
故事是真的:結構性電力缺口存在,CAT 真實卡位,底部比空方想的高。
但 $876 已經預付了結構故事的大部分,卻沒有為週期風險打任何折。
六個月視角:盈餘動能對上倍數重力——重力的勝率略高。
CEO Joe Creed took office 2025-05-01 and added the chairman title on 2026-04-01 (his predecessor, Umpleby, fully retired that same day) ✓. This analysis specifically checked one thing: insiders made zero open-market stock trades in 2026 — the only activity on their Form 4 filings (the SEC form that discloses insider trading) is routine tax withholding tied to RSU vesting and phantom units ✓ StockTitan. That means any "insider selling" story about this stock doesn't hold up and should not be repeated.
CEO Joe Creed(2025-05-01 就任;2026-04-01 起兼董事長,前任 Umpleby 同日完全退任)✓。本研究特別查了一件事:內部人 2026 年沒有在公開市場買賣過一次股票——Form 4(SEC 規定內部人交易要申報的表格)上唯一的活動,只是 RSU 歸屬時的稅務代扣與 phantom units(✓ StockTitan)。也就是說,任何「內部人賣股」的說法都站不住腳,不該被引用。
Capital allocation: stock buybacks ran $4.98B / $7.70B / $5.19B in FY23-25, and already $6.52B in the first half of 2026 (including a $4.5B ASR) ✓ 10-K/releases; dividends have risen for 32 straight years ✓. The company's manufacturing-and-energy net debt (borrowed money minus cash on hand) was $5.04B as of 2026-06-30 (cash $5.9B against debt $11.0B) ✓ 2Q26 release pp.22-23 — the faster pace of buybacks pulled first-half cash down $3.4B, but leverage still remains very low. M&A has stayed small and targeted (RPMGlobal, Skycatch — both software-layer deals) ✓.
資本配置:股票買回 FY23-25 分別是 $4.98B/$7.70B/$5.19B,2026 上半年已達 $6.52B(含 $4.5B 的 ASR)✓ 10-K/releases;股息連增 32 年 ✓。製造與能源業務的淨負債(借的錢減去手上的現金)截至 2026-06-30 是 $5.04B(現金 $5.9B、負債 $11.0B)✓ 2Q26 release pp.22-23——買回加速讓上半年現金減少 $3.4B,但槓桿仍然非常低。併購維持小而準(RPMGlobal、Skycatch,都是軟體層的交易)✓。
No named research house publishes a market-share percentage for large-engine manufacturers ◆ not foundNOT FOUND. Instead, this analysis presents it the way the evidence actually supports: "only a handful of players can deliver at gigawatt scale," plus each rival's own named capacity build-out — see the competitor capacity-race table in §What drives volume. On geography: roughly 29 plants and 14,000 employees in Mexico is CAT's main line of exposure to tariffs ✓ FreightWaves.
沒有具名研究機構公布大型引擎製造商的市占率百分比(◆ NOT FOUND)。本研究改用證據真正能支撐的講法呈現:「能以 GW 級規模交付的廠商只有一手之數」,加上每一家對手自己公布的擴產計畫——詳見「什麼會放量」章節的競爭者產能競賽表。地理上:CAT 在墨西哥約 29 座工廠、14,000 名員工,是它暴露在關稅風險下的主要一條線 ✓ FreightWaves。
16 terms used across this page.
本文用到的 16 個術語。
| Claim主張 | Verdict判定 | Value · source · as-of數值 · 來源 · 日期 |
|---|---|---|
| Price & valuation價格與估值 | ||
| 1. Close $876.54 (2026-08-04)收盤 $876.54(2026-08-04) | ✓ | IBKR daily bar 08-04 |
| 2. YTD +54.97% | ✓ | IBKR 08-05 |
| 3. 52wk $403.32-1,073.4652週 $403.32-1,073.46 | ✓ | IBKR misc_statistics |
| 4. Peak close $1,064.90 on 2026-06-30; $1,073.46 was an intraday high, not a close峰值收盤 $1,064.90 @ 2026-06-30;$1,073.46 為盤中高 | ✗→✓ | IBKR daily (corrects a secondary site's close/high conflation)IBKR daily(更正 stockanalysis「6/30 收盤 1073.46」) |
| 5. 07-29 close $782.71 (-6.9%)7/29 收盤 $782.71(單日 -6.9%) | ✓ | IBKR daily |
| 6. July -23.5%, worst month since 20097 月單月 -23.5%(2009 以來最差) | ✓ | IBKR daily, computed; corroborated by 24/7 Wall StIBKR daily 計算;24/7 Wall St 語句印證 |
| 38. Diluted weighted shares 462.5M (2Q26 quarter)稀釋加權股數 462.5M(2Q26 單季) | ✓ | 2Q26 release p.15; point-in-time share count NOT FOUND (10-Q not yet filed)2Q26 release p.15;point-in-time 股數 NOT FOUND(10-Q 未上架) |
| 75. Consensus FY26E rev $76.61B/EPS $24.72; FY27E EPS $31.08共識 FY26E 營收 $76.61B/EPS $24.72;FY27E EPS $31.08 | ✓ flagged pre-Q2, stale標註 pre-Q2 過時 | stockanalysis 07-29 · Zacks via MarketBeat 07-16 |
| 76. 28 sell-side analysts: SB13/B1/H12/S1/SS1; avg TP $963.56 (high $1,218/low $575)賣方 28 位:SB13/B1/H12/S1/SS1;平均 TP $963.56(高 $1,218/低 $575) | ✓ pre-Q2pre-Q2 | stockanalysis 07-29 |
| 77. Oppenheimer post-Q2 $1,105→$1,118Oppenheimer post-Q2 $1,105→$1,118 | ✓ | Investing.com 08-04 |
| 80. 10yr PER median 18.45x; 2018-24 band ~12-19x10 年 PER 中位 18.45x;2018-24 帶 ~12-19x | ⚠ | GuruFocus/wisesheets snippet (403, original page unreadable); corroborated by Investing.com "historically 15-20x forward"GuruFocus/wisesheets snippet(403 未讀原頁);Investing.com「歷史 15-20x forward」語句互證 |
| 81. InvestingPro fair value $599.50 (-34.6%)InvestingPro 公允值 $599.50(-34.6%) | ✓ | Investing.com 08-04 |
| 82. Dow weight ~10.6-11% (2nd largest)Dow 權重 ~10.6-11%(第二大) | ✓ | Motley Fool 07-18 |
| Financials & guidance財務與指引 | ||
| 7-11. Q2'26: released 2026-08-04 pre-market; rev $20.543B (+24%); adj EPS $8.17/GAAP $7.77; adj op. margin 21.9%; incl. $392M IEEPA tariff recoveryQ2'26:2026-08-04 盤前發布;營收 $20.543B(+24%);adj EPS $8.17/GAAP $7.77;adj 營益率 21.9%;含 $392M IEEPA 關稅回收 | ✓ | 2Q26 release pp.1-4 |
| 12-13. Q2'26 segments (P&E $8.238B/$2.027B; CI $8.346B/$1.947B; RI $4.648B/$0.693B; FP $1.145B/$0.328B); PG $3.098B +29%Q2'26 分部(P&E 8.238/2.027;CI 8.346/1.947;RI 4.648/0.693;FP 1.145/0.328);PG $3.098B +29% | ✓ | 2Q26 release pp.2-9 |
| 14. PG sales-to-users +72% (call metric, distinct from the filed-revenue figure)PG sales-to-users +72%(call 口徑,與 filed 營收不同指標) | ✓ | 2Q26 call transcript (Benzinga/Investing.com)2Q26 call transcript(Benzinga/Investing.com) 08-04 |
| 16-18. Tariffs Q2 ~$400M, FY26 guide ~$2.2B; FY26 revenue guide raised to mid-to-high teens; MP&E FCF guide "upper half of $6-15B"關稅 Q2 ~$400M;FY26 指引 ~$2.2B;FY26 營收指引升至 mid-to-high teens;MP&E FCF 指引「$6-15B 目標帶上半」 | ✓ | 2Q26/1Q26 release + call |
| 19-21. Q1'26: rev $17.415B (+22%); adj EPS $5.54/GAAP $5.47; adj op. margin 18.0%; segments (P&E 7.031/1.450; CI 7.161/1.535; RI 3.797/0.378; FP 1.096/0.245)Q1'26:營收 $17.415B(+22%);adj EPS $5.54/GAAP $5.47;adj 營益率 18.0%;分部(P&E 7.031/1.450;CI 7.161/1.535;RI 3.797/0.378;FP 1.096/0.245) | ✓ | 1Q26 release PDF pp.1-9 |
| 23-24. Q1'26 tariffs ~$600M; PG Q1'26 $2.817B +41%Q1'26 關稅 ~$600M;PG Q1'26 $2.817B +41% | ✓ | Q1'26 transcript p.4 · 1Q26 release |
| 25. RI Q1'26 profit -39%, margin 10.0% (~500bps tariff drag)RI Q1'26 利潤 -39%、margin 10.0%(關稅致 ~500bps) | ✓ ⚠ 500bps breakdown from Trefis500bps 拆解出自 Trefis | release ✓ · Trefis 06-23 ⚠ |
| 26-30. FY25: rev $67.589B (+4%); adj EPS $19.06/GAAP $18.81; adj op. margin 17.2% (vs. 2024's 20.7%); segment rev/profit as filedFY25:營收 $67.589B(+4%);adj EPS $19.06/GAAP $18.81;adj 營益率 17.2%(vs 2024 的 20.7%);分部營收/利潤 as filed | ✓ | FY25 10-K (SEC) pp.31-33 |
| 31. FY25 tariffs ~$1.8B (derived from the 10-K); the call quoted $1.7B, a $100M gap unresolvedFY25 關稅 ~$1.8B(10-K 推導);call 口徑 $1.7B,差 $100M 未解 | ✓ derived推導 ⚠ | 10-K p.29 · Fool transcript ⚠ |
| 33-35. FY25 MP&E FCF $9.5B; FY24 rev $64.809B/EPS $22.05; FY23 rev $67.060B/EPS $20.12; FY24/23 adj EPS $21.90/$21.21FY25 MP&E FCF $9.5B;FY24 營收$64.809B/EPS $22.05;FY23 $67.060B/$20.12;FY24/23 adj EPS $21.90/$21.21 | ✓ ⚠ adj EPS via PRNewswire, not primary PDFadj EPS 經 PRNewswire 轉引 | Q4'25/Q1'26 calls · FY25 10-K · PRNewswire |
| 71. 2012 peak rev $65.875B/EPS $8.48 → 2016 $38.537B(-41.5%)/EPS -$0.11; 11 years below peak; 2020 rev -22%/adj EPS -42% ($11.40→$6.56), dealer destock $2.9B2012 峰值 $65.875B/EPS $8.48 → 2016 $38.537B(-41.5%)/EPS -$0.11;11 年低於峰值;2020 營收 -22%/adj EPS -42%($11.40→$6.56)、經銷商去庫 $2.9B | ✓ | CAT FY2012/2016/2020 releases (PRNewswire/SEC) |
| Business & moat業務與護城河 | ||
| 15, 22, 32. Backlog: 2Q26 $72B +92% YoY, +$9B QoQ, 59% converts within 12mo; 1Q26 $63B +79%; FY25 year-end $51B +71%Backlog:2Q26 $72B +92% YoY、+$9B QoQ、59% 12個月內轉化;1Q26 $63B +79%;FY25 年底 $51B +71% | ✓ 2Q26/1Q26 call2Q26/1Q26 call ⚠ FY25 figure via secondary Fool paraphraseFY25 數字經 Fool 轉述 | call transcripts, not filing tablescall 轉述,非 filing 表格 |
| 41. P&E renamed 2025-11-04; rail/marine moved to RI effective 2026-01-01; comparison periods restated (1Q25 $5.783B, 2Q25 $7.037B)P&E 更名(2025-11-04);rail/marine 2026-01-01 移入 RI;比較期重編(1Q25 $5.783B、2Q25 $7.037B) | ✓ | Int'l Mining 11-04 · 1Q/2Q26 releases |
| 42-43. FY25 PG >$10B, +30%+; old-basis 3Q25 PG $2.634B +31%, 4Q25 PG $3.238B +44%FY25 PG 全年 >$10B、+30%+;舊口徑 3Q25 PG $2.634B +31%、4Q25 PG $3.238B +44% | ⚠ ✓ 3Q/4Q253Q/4Q25 | Q4'25 call ⚠ · 3Q/4Q25 releases (PRNewswire) ✓ |
| 44-46. Large-engine capacity 2x→~3x/2024, +15GW/yr, capex mainly 2027-29; turbine capacity ~2.5x; 10MW medium-speed platform restarting, 1.5GW, 4Q26; lead times turbines 2H28-29, diesel gensets 2028大引擎產能 2x→~3x/2024、+15GW/年、capex 主要 2027-29;渦輪 ~2.5x;10MW 中速平台復產 1.5GW、4Q26 出貨;交期渦輪 2H28-29、柴油 genset '28 | ✓ | Q1'26/2Q26 call transcripts + Manufacturing Dive |
| 47-49. Monarch 2GW (largest-ever power contract, 2026-09~2027-08 delivery); PROPWR up to 2.1GW, "6th ≥1GW prime-power agreement"; "No customers are slowing down," orders booked to '29/'30Monarch 2GW(史上最大電力合約,2026-09~2027-08 交付);PROPWR 至多 2.1GW,「第六份 ≥1GW prime power 協議」;「No customers are slowing down」,訂單排至 '29/'30 | ✓ | CAT IR PR 2026-01-28 · Q1'26/2Q26 transcripts |
| 50, 83. Lafayette, IN plant $725M; ~29 Mexico plants / 14,000 employees (tariff exposure)Lafayette, IN 廠 $725M;墨西哥 ~29 廠/14,000 員工(關稅暴露) | ✓ ⚠ | Manufacturing Dive · FreightWaves/Yahoo |
| 59-62. 156 dealers (43 US/113 int'l), 191 countries; services rev $14B(2016)→$22B(2023)→~$24B (year basis ⚠), 2026 target $28B, 2030 $30B; ~690 autonomous trucks, >11B cumulative tonnes; RPMGlobal/Skycatch acquisitions156 家經銷商(美43/外113),191 國;services $14B(2016)→$22B(2023)→約$24B(年度口徑⚠)、2026目標$28B、2030 $30B;~690台自主礦卡、>11B噸累計運量;RPMGlobal/Skycatch 收購 | ✓ ⚠ $24B year attribution$24B 年度歸屬 | FY25 10-K Item 1 · Digital Commerce 360 · International Mining 2025-11-07 |
| 84. Frame agreements include cancellation penalties + prepaymentsFrame agreements 含取消罰則+預收款 | ⚠ secondhand call paraphrase, not verified word-for-word二手轉述 call 語句,未逐字核對 | 2Q26 call (Kaiser) |
| Industry & demand產業與需求 | ||
| 51-53. GEV backlog 116GW, "mostly sold out through 2030," ≥125GW by end-2026, >half of 2031 booked; Siemens Energy ~60GW, booked to FY28, 4yr wait; MHI ¥3.6T (+40%), up to 7yr wait, capacity doubling in 2yrsGEV backlog 116GW、「mostly sold out through 2030」、年底≥125GW、2031 過半契約化;Siemens Energy ~60GW、訂單排至FY28、四年等待;MHI ¥3.6T(+40%)、最長7年等待、兩年內產能翻倍 | ✓ | GEV 2Q26 transcript 07-22 · S&P Global 06-30 · DCD |
| 54-57. Cummins $150M MN expansion + Circe TX order; Wärtsilä >2.4GW US data centers, 790MW TX order; mtu backup covers >25% of US data centers, Mankato capacity doublingCummins $150M 明州擴產+Circe德州案;Wärtsilä 美國DC累計>2.4GW、790MW德州單;mtu備援覆蓋>25%美國資料中心、Mankato倍增產能 | ✓ | Cummins PR 06-16 · Wärtsilä PR 04-23 · Rolls-Royce PR |
| 55. Cummins "55GW by 2030" targetCummins「55GW by 2030」 | ⚠ aggregator source, primary not located彙整來源,primary 未定位 | — |
| 58. WoodMac: orders 110GW vs. capacity 60-70GW/yr, 6yr lead time, prices +195% since 2019, $600/kW projected by end-2027WoodMac:訂單 110GW vs 產能 60-70GW/年、6 年交期、價格 +195%、2027 底看 $600/kW | ✓ | Wood Mackenzie PR 2026-04-01 |
| 63-65. IEA: data-center power 485→~950 TWh (2025→30), ~3% of global; EPRI: US share reaches 9-17% by 2030; Goldman ~122GW by 2030 (+165% vs. '23); McKinsey 171-219GW/$6.7TIEA:DC 用電 485→~950 TWh (2025→30)、~3% 全球;EPRI:美國占比 2030 達 9-17%;Goldman:DC 電力 2030 ~122GW(+165% vs '23);McKinsey 171-219GW、$6.7T | ✓ | IEA Electricity 2026 (02) · EPRI 02 · GS Research 2025-02 · McKinsey |
| 66-67. GEM: ~101GW BTM gas power announced, ≥46 data centers/56GW pursuing BTM; interconnection queue 5-7 yearsGEM:BTM 氣電 ~101GW 公告、≥46 座資料中心/56GW 採 BTM;併網隊列 5-7 年 | ✓ | Global Energy Monitor · GEM + Evercore(Raso) via Fool 08-03 + cat.com white paper |
| 68-69. Baird downgrade (Dobre, Neutral, $1,200→$900, 07-29); same-day Erste downgrade to Hold; ~75 projects/$130B delayed/blocked Q1; Maine ban (04); NY ≥50MW 1yr moratorium (Hochul EO 07-14)Baird 降評(Dobre,Neutral,$1,200→$900,07-29);同日 Erste 降 Hold;75 案/$130B Q1 延宕封殺;Maine 禁令(04);NY ≥50MW 一年 moratorium(Hochul EO 07-14) | ✓ | CNBC/Yahoo/Investing 07-29 · CNBC/WaPo/DLA Piper 07-14 |
| 70. Sightline: 30-50% of 2026 projects at risk of delay/cancellation; Q1 20+ projects/$41.7B/3.5GW cancelledSightline:2026 案 30-50% 恐延後/取消;Q1 20+ 案/$41.7B/3.5GW 取消 | ⚠ via Bloomberg paraphrase, original not locatedBloomberg 轉述未見原文 | — |
| 72-74. China: property investment -18%/new starts -23.4% (H1'26); excavator domestic sales +20.4%, exports +33.5%; N. America nonres -7% YTD, mfg plants -9.6%, infra +5-7%; upstream capex down 2yrs straight ($59.1B -5%); offshore 2026 -24% to $85B中國:地產投資 -18%/新開工 -23.4%(H1'26);挖機內銷 +20.4%、出口 +33.5%;北美 nonres -7% YTD、製造廠房 -9.6%、基建 +5-7%;上游 capex 連二年降(36家E&P $59.1B -5%);離岸 2026 -24% 至 $85B | ✓ | NBS via SteelOrbis 07-20 · CCMA via Mysteel · AIA/Census 2026-07 · RBN/OilPrice · Clarksons via OGJ |
| Capital & ownership資本與持股 | ||
| 36. Dividend $1.63/qtr (announced 2026-06-10, +8%), 32 consecutive years股息 $1.63/季(2026-06-10 宣布 +8%)、連增 32 年 | ✓ | PRNewswire 06-10 ("33 years" per TipRanks is a misprint, dropped)PRNewswire 06-10(「33 年」為 TipRanks 誤植,棄用) |
| 37. Buybacks FY23 $4.975B / FY24 $7.697B / FY25 $5.190B; 2026 H1 $6.522B (incl. $4.5B ASR)買回 FY23 $4.975B/FY24 $7.697B/FY25 $5.190B;2026 H1 $6.522B(含 ASR $4.5B) | ✓ | 10-K + 2Q26 release p.17 |
| 39-40. MP&E net debt $5.038B (cash $5.945B vs. debt $10.983B, 2026-06-30); enterprise cash $6.7BMP&E 淨債 $5.038B(現金 5.945 vs 債 10.983,2026-06-30);企業現金 $6.7B | ✓ | 2Q26 release pp.1, 22-23 |
| 78. Institutional ownership ~72%; insider <~1% (source range 0.22-1.13%, definitions vary)機構持股 ~72%;內部人 <~1%(來源區間 0.22-1.13%,定義不一) | ⚠ | WallStreetZen, ~2026-05 data, dated |
| 79. Zero open-market insider trades in 2026 (Form 4s are RSU tax-withholding/phantom units only)內部人 2026 無公開市場買賣(僅 RSU 稅務代扣/phantom units) | ✓ | Form 4 via StockTitan (Creed 03-03/05-11 withholdings) |
| Judgment ◆ (not a verified claim — this analysis's own construction)判斷 ◆(非查證項目 — 本研究自行建構) | ||
| TP formula: 2027E adj EPS $30.00 × 26x PER = $780目標價公式:2027E adj EPS $30.00 × 26x PER = $780 | ◆ | this analysis本研究 |
| Scenario probabilities bear 25%/base 50%/bull 25%情境機率 bear 25%/base 50%/bull 25% | ◆ subjective主觀 | this analysis本研究 |
| Playbook rows (entry zone, invalidation triggers, why-not-short)操作框架各列(進場區、失效條件、為何不放空) | ◆ | this analysis本研究 |
| Dropped (couldn't verify → excluded from the page)已剔除(無法查證 → 不得上頁) | ||
| WTI spot $77.84 (contradicted the 2026 forecast band)WTI 現貨 $77.84(與 2026 預測帶矛盾) | ⚠ dropped剔除 | — |
| "O&G = 29% of P&E" (unverified aggregator figure)(未驗聚合數字) | ⚠ dropped, replaced by this analysis's own H1'26 22.7%剔除,改用本研究 H1'26 22.7% 自算 | ainvest, unverified |
| Any "insider selling" narrative「內部人賣股」任何敘事 | ⚠ disproven, see #79已證偽,見 #79 | — |
| "33 consecutive dividend years年連增" (TipRanks misprint) | ✗→ corrected to 32更正為 32 | — |
| tradingkey "Q3 miss" narrative「Q3 miss」敘事 | ⚠ dropped, no such July Q3 report exists剔除,CAT 無 7 月 Q3 財報,內容農場 | — |
| Vertiv partnership claim合作案 | ⚠ dropped, secondhand (TIKR), primary not verified剔除,TIKR 二手,未驗 primary | — |
| Copper capex $33B/$210B figures銅 capex $33B/$210B | ⚠ dropped, aggregator citing unread WoodMac/S&P; page keeps only directional copper/gold project driver剔除,彙整轉引未讀原文;頁面僅方向性提銅金專案驅動 | — |
First build of this page. Research view: Avoid. Target price $780 (6-month horizon, 2027E adj EPS $30.00 × 26x PER), implied -11.0% vs. the $876.54 close. No prior model exists to revise against.
本頁首次建置。研究觀點:迴避。目標價 $780(6 個月,2027E adj EPS $30.00 × 26 倍 PER),對收盤 $876.54 隱含 -11.0%。無前一版模型可供對照。
| Date日期 | Action動作 | View觀點 | TP | Close收盤 |
|---|---|---|---|---|
| 2026-08-05 | Initial coverage初次評估 | Avoid迴避 | 780 | 876.54 |
Append-only ledger — entries are never deleted, only restated on the record.附加式(append-only)紀錄;條目永不刪除,只在紀錄上更正。